Published on International Business Times on 25 July 2013.
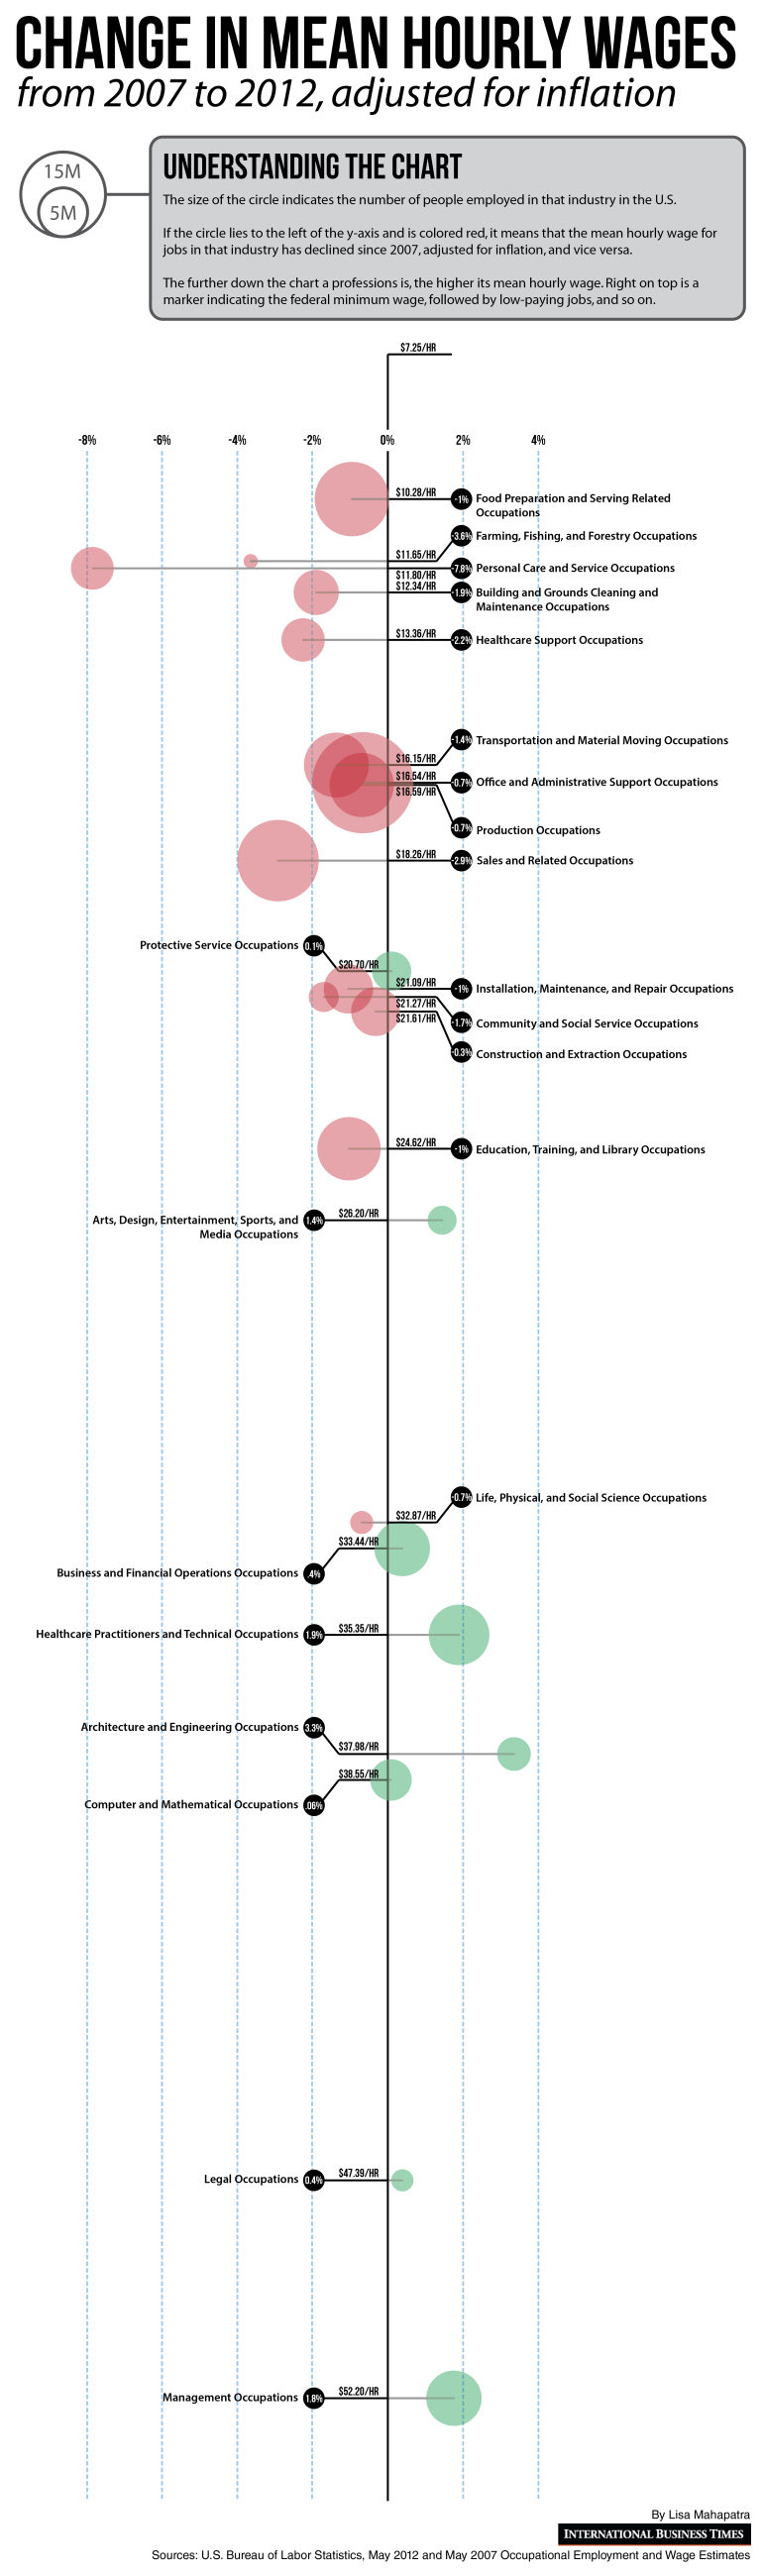
As of 2012, hourly wages for low-paying jobs were just not keeping up with inflation, according to my analysis of BLS data. This chart was deliberately designed to be very long, as I felt that forcing the viewer to scroll to see the full visual distance between the lowest-paid and the highest-paid workers was an effective way to communicate the disparity between the two.
