Flatfile is a yes-code data exchange platform that allows our customers to use our specialized UIs for data mapping, validation and error resolution, configured with their schemas and custom workflows.
I designed Turntable to make it easier for users to find errors in their data, and then fix them.
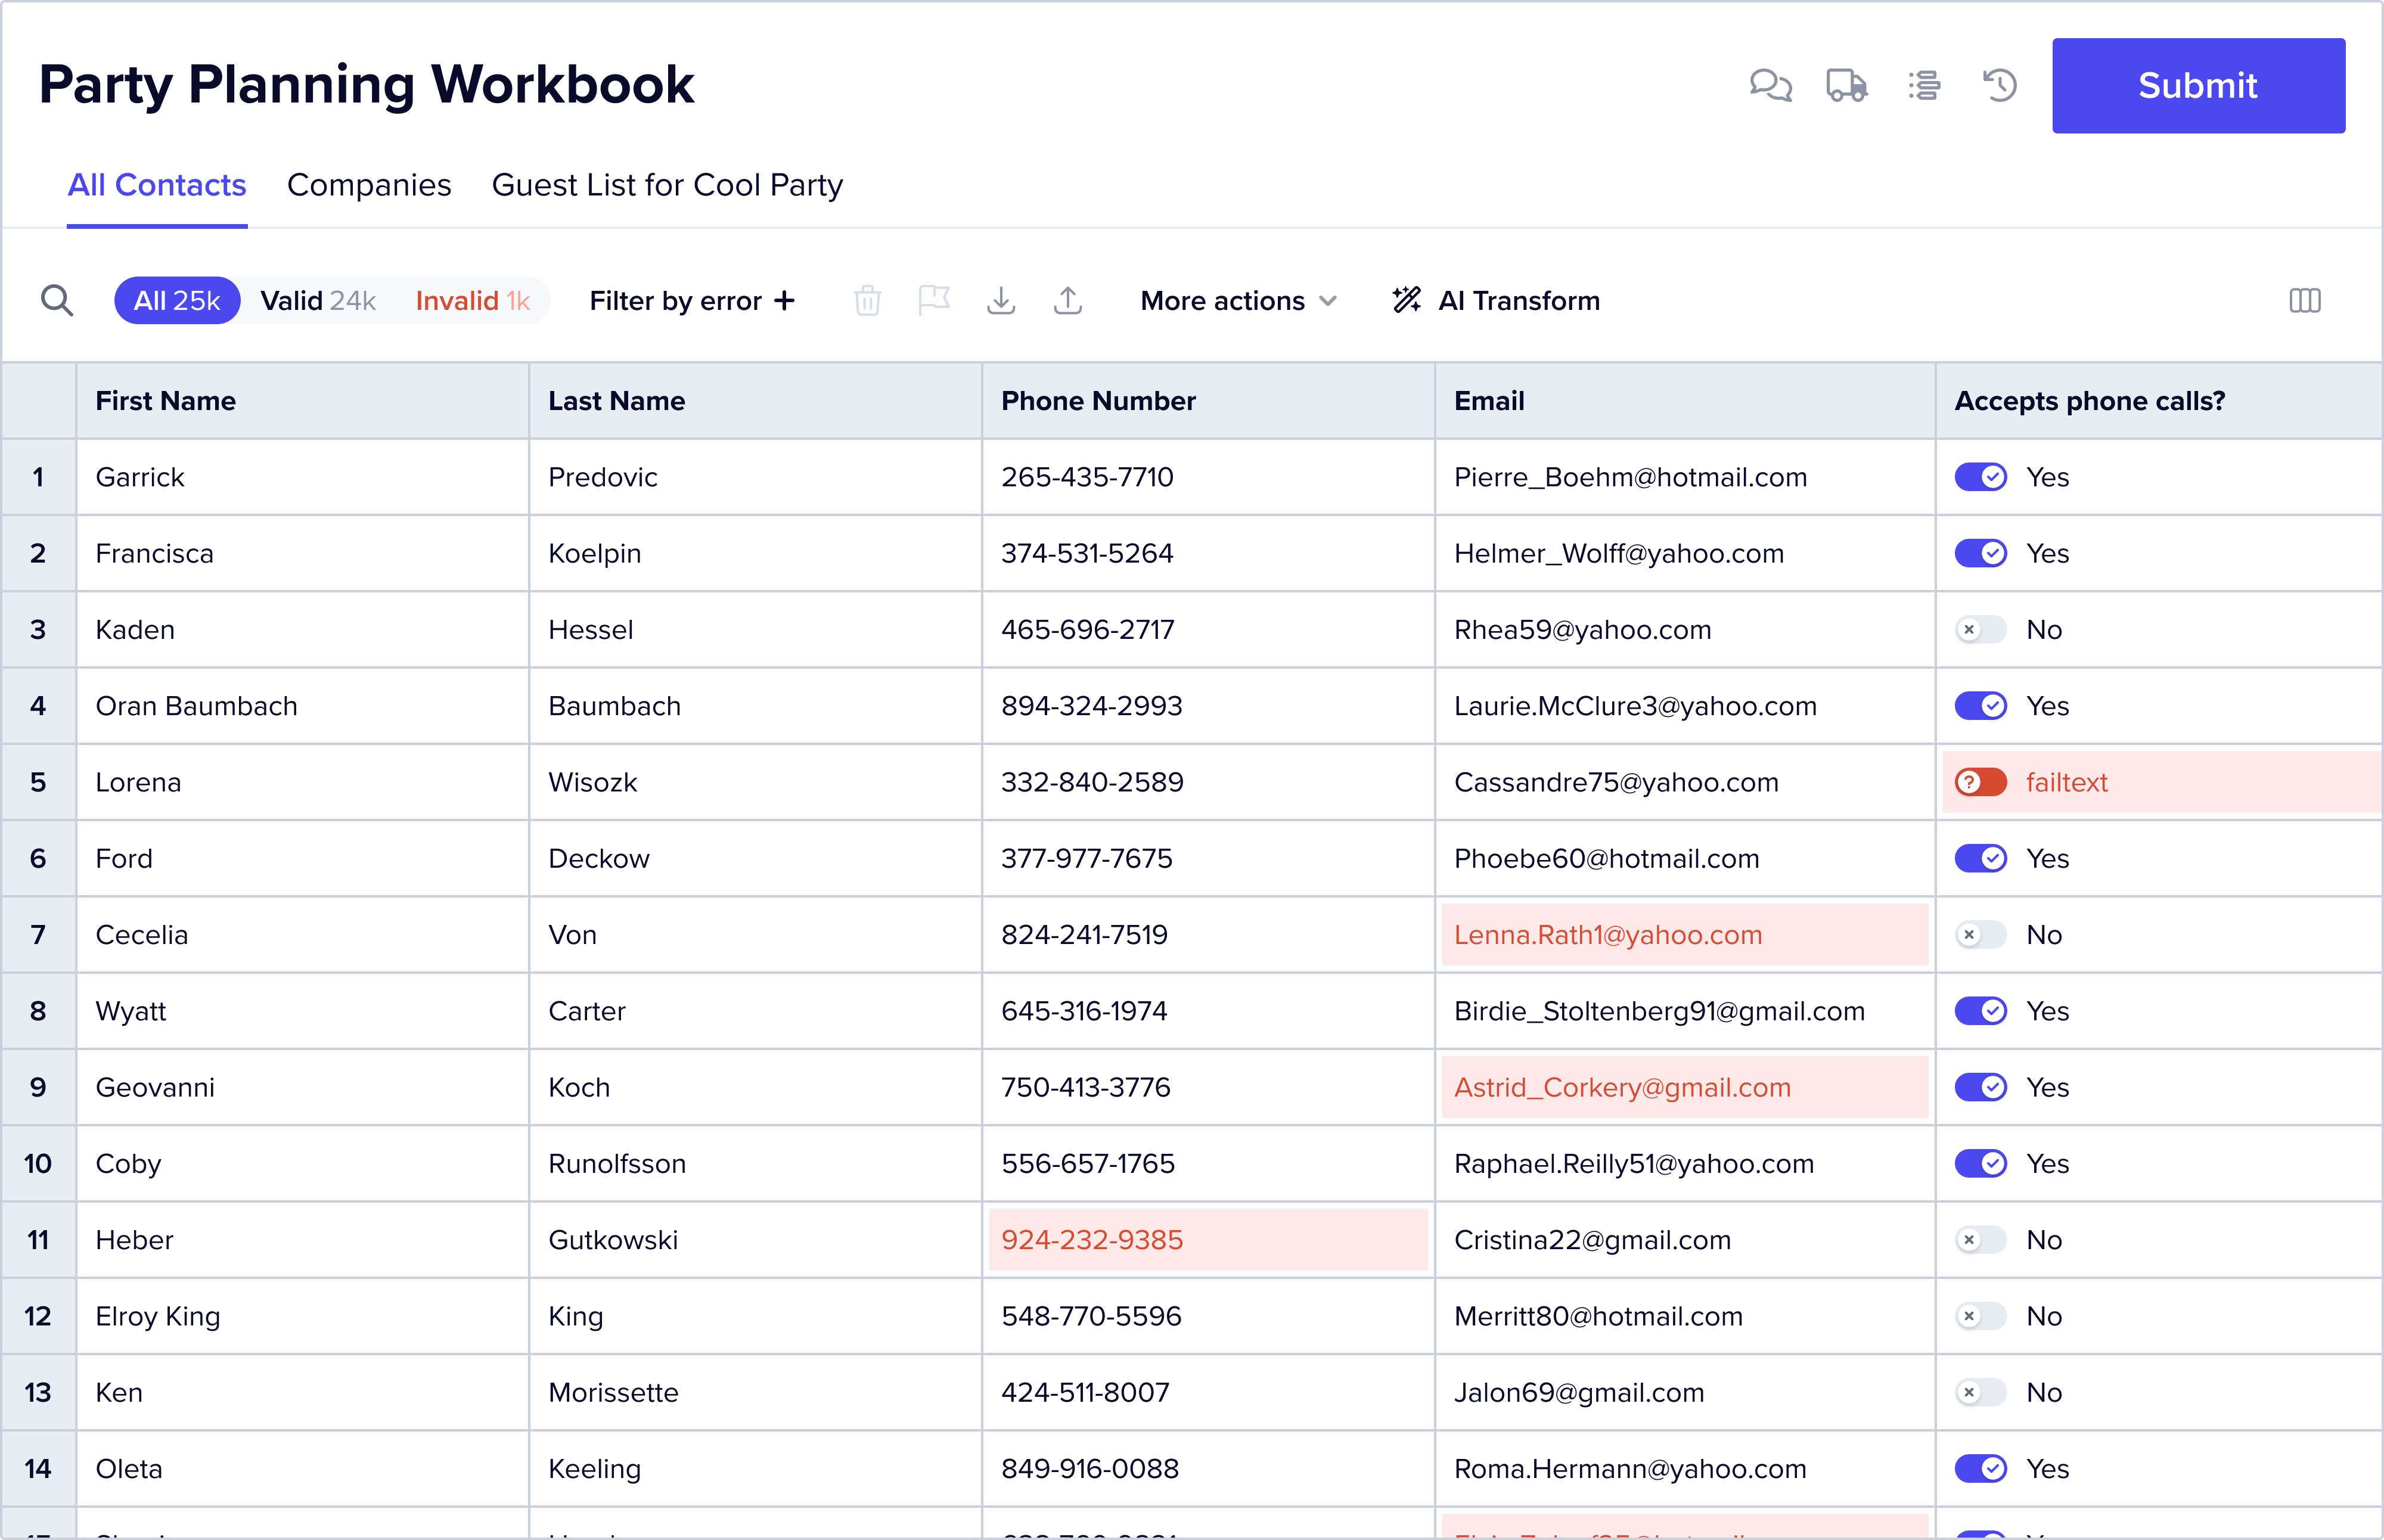
Imagine an event management app where an event manager can upload their guest lists and then manage how they communicate with their guests. The event management app builder is Flatfile’s customer. This management app needs data in CSV files as per a schema along the lines of “First Name, Last Name, Email, Phone, Address line 1, address line 2, city, state, zip, Guest Type, Invite Sent, RSVP status”.
The event manager, i.e., the end user, needs to upload their guest list to the event management app. Unfortunately, a particular event manager has their data in google sheets, it has a single “name” column (containing first+last), a single “address” column (containing street address, city, state, zip), and an email column with lots of invalid email addresses. Other end users have their data in different (but still incompatible) formats.
Flatfile’s core mission is solving this problem.
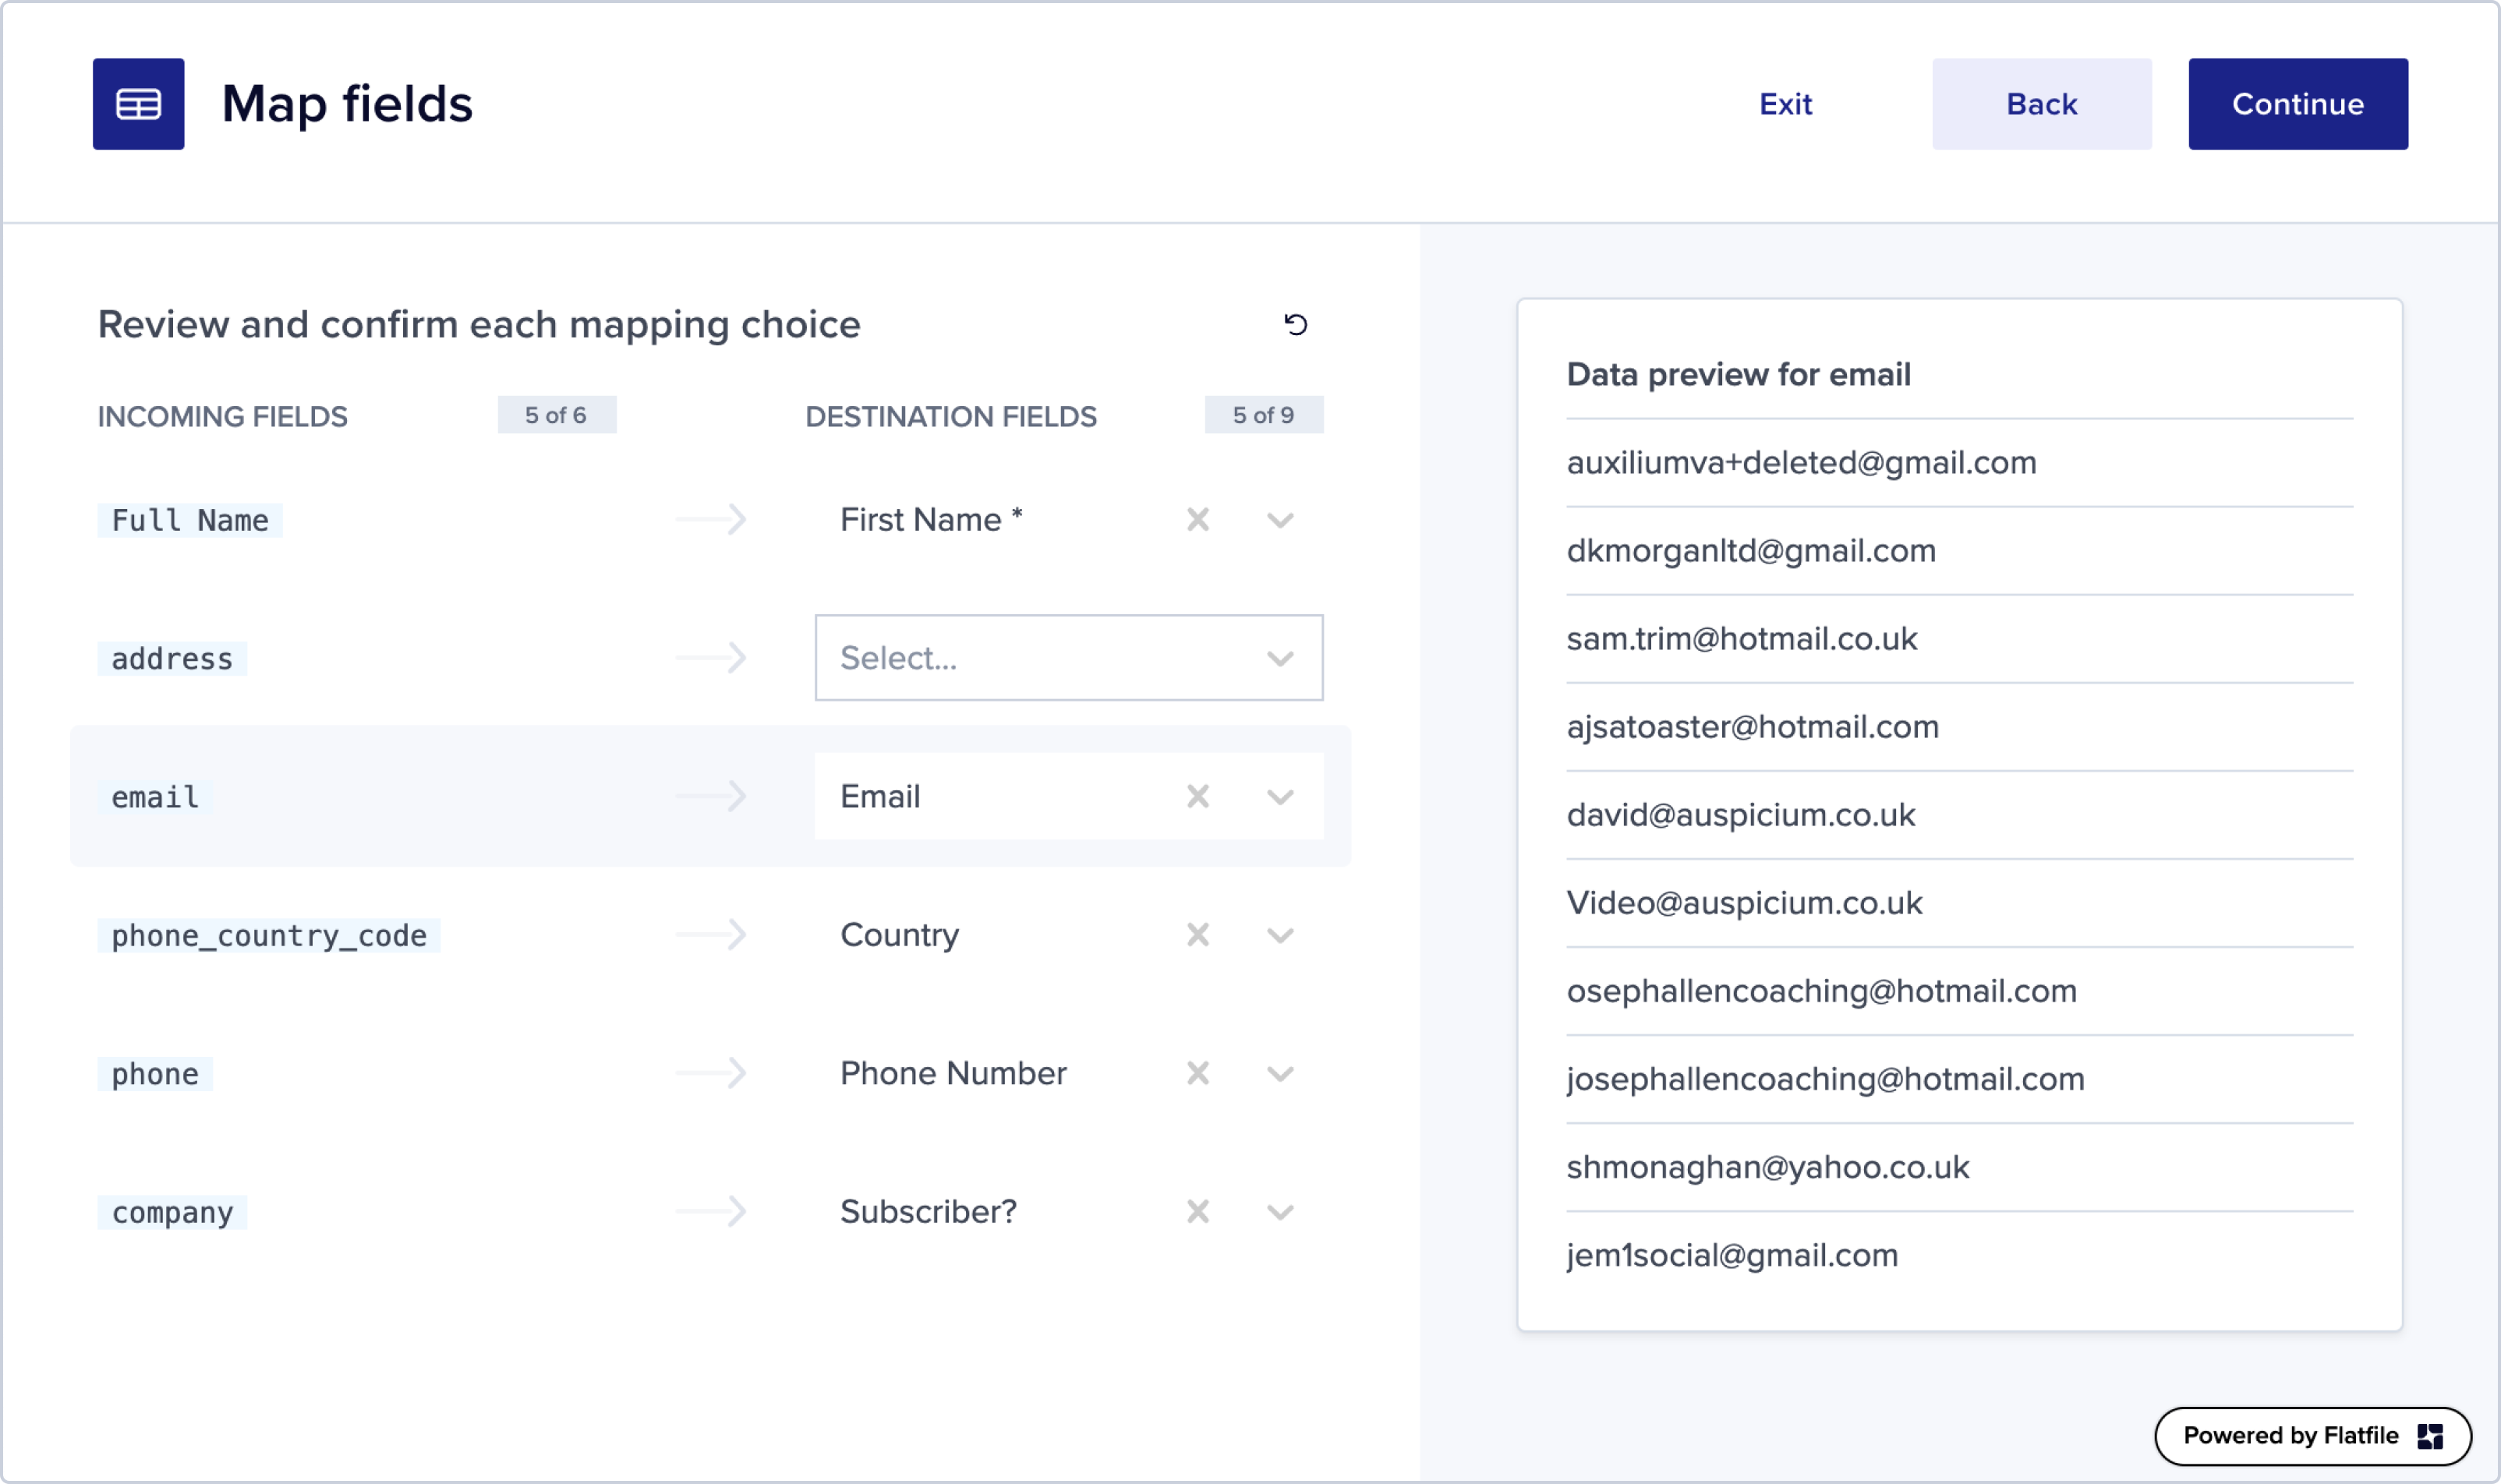
The first step in solving this problem is transforming the data from the end user’s format to the customer’s format – this is done in Flatfile’s mapping UI, which is shown to the end user and makes it easy to transform data into the format expected by the customer.
After transforming the data the end user can review and correct any errors they see (e.g. guests with invalid emails or similar). Turntable – the topic of this blog post – is the user interface provided by Flatfile for data review and error resolution.
Here’s how our customers can configure the Turntable UI to make it easier for their end users to validate and correct their data:
Highlighting errors
Flatfile makes it easy to encode validation rules that mark problematic data as either errors or warnings.
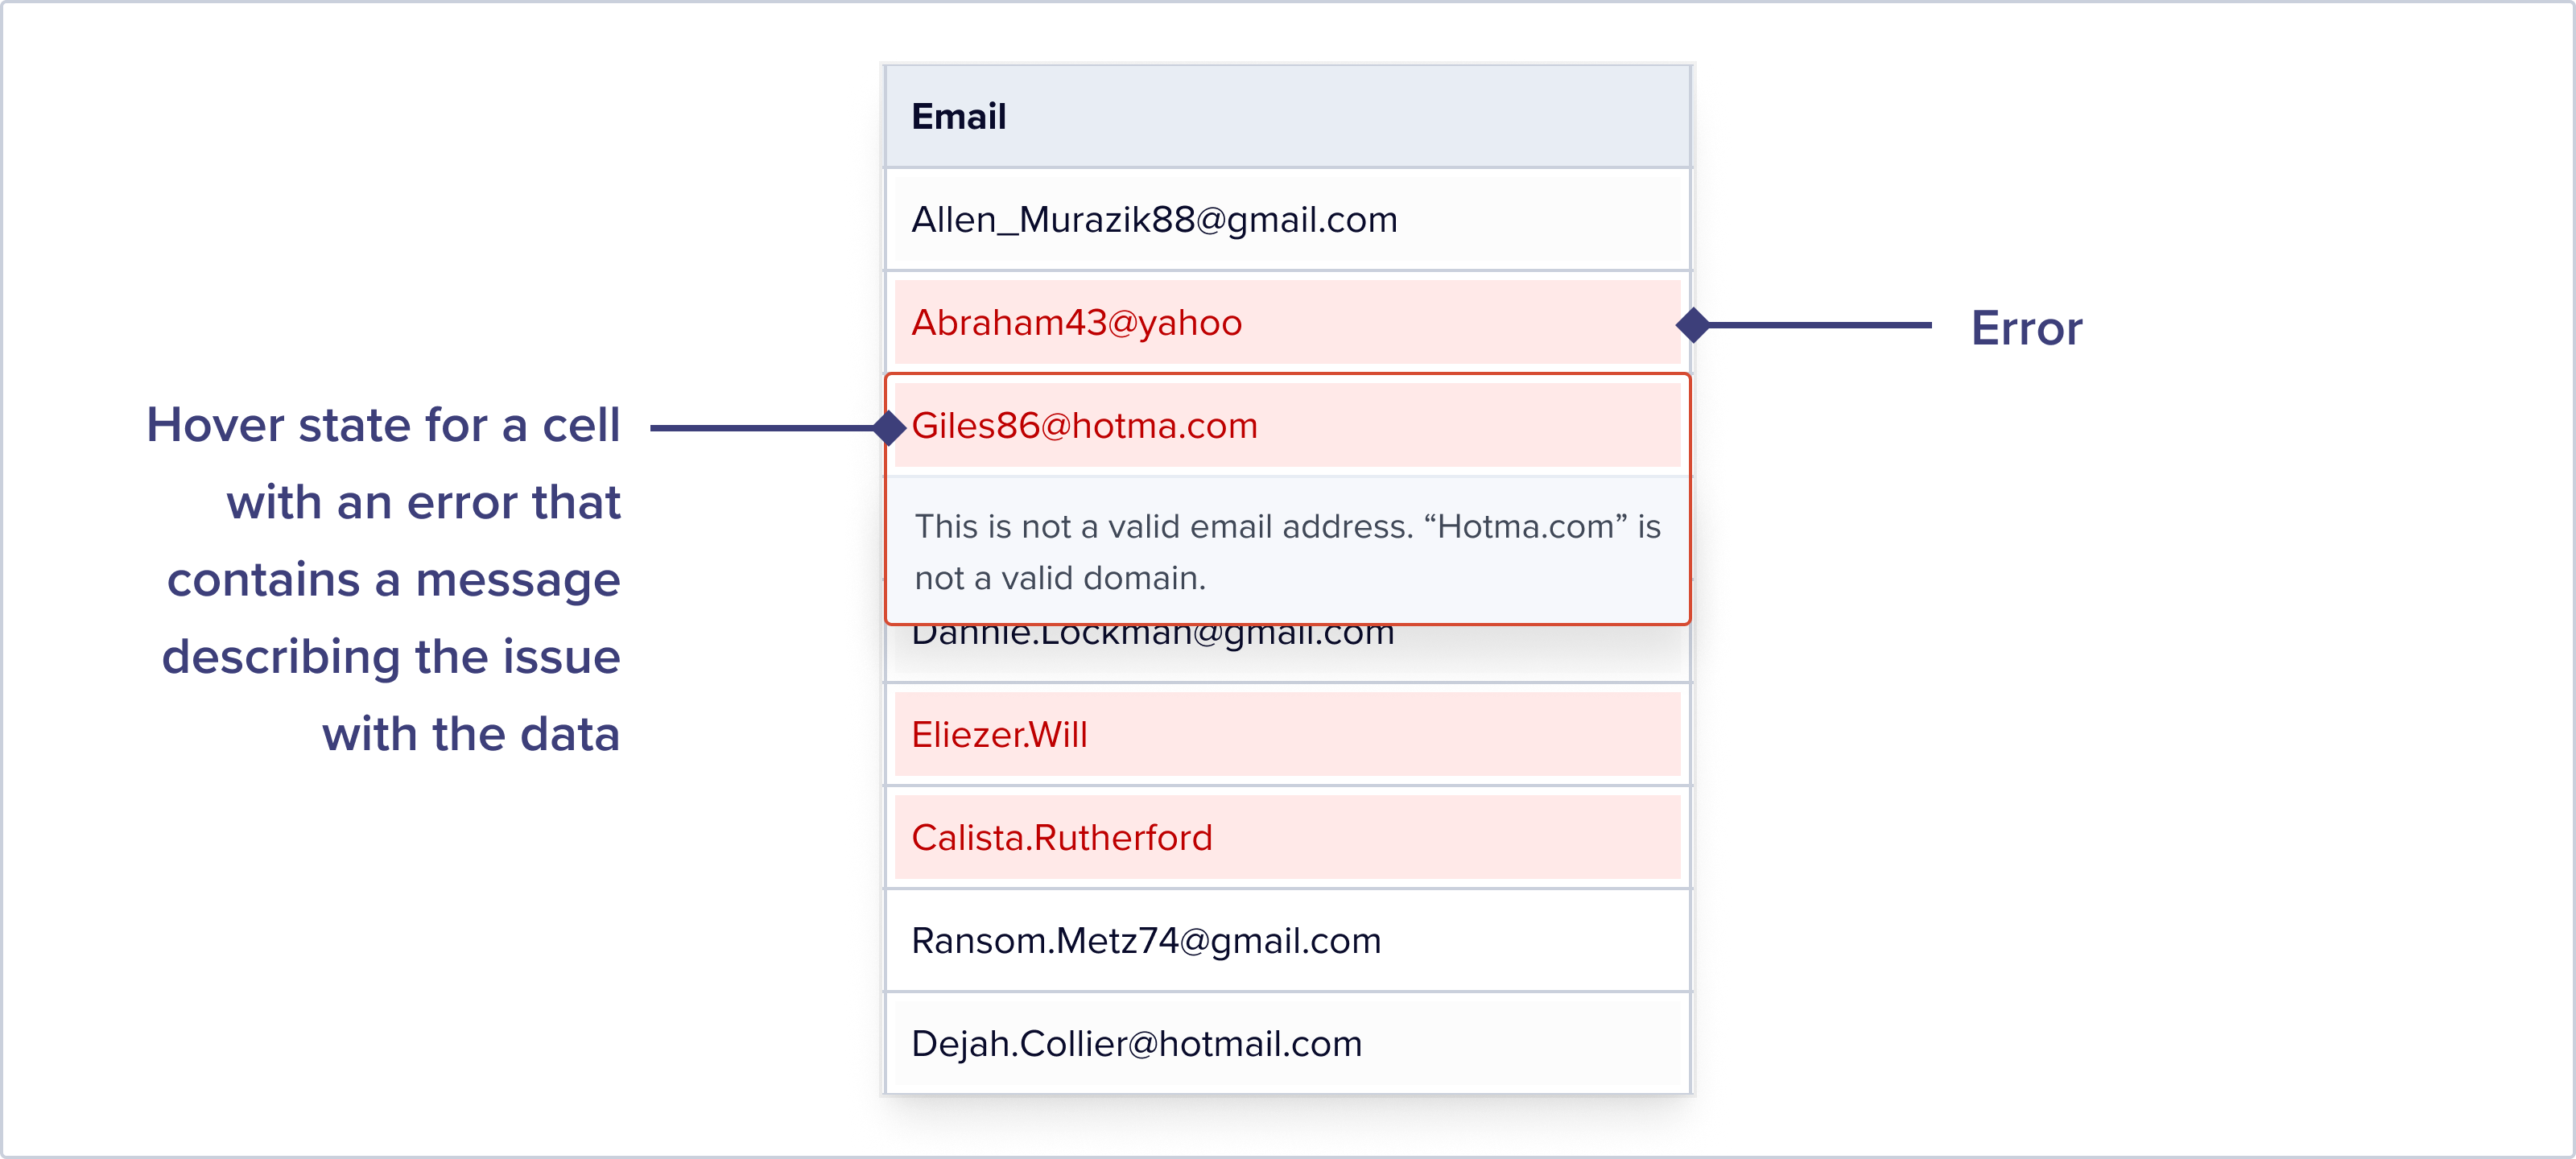
Errors
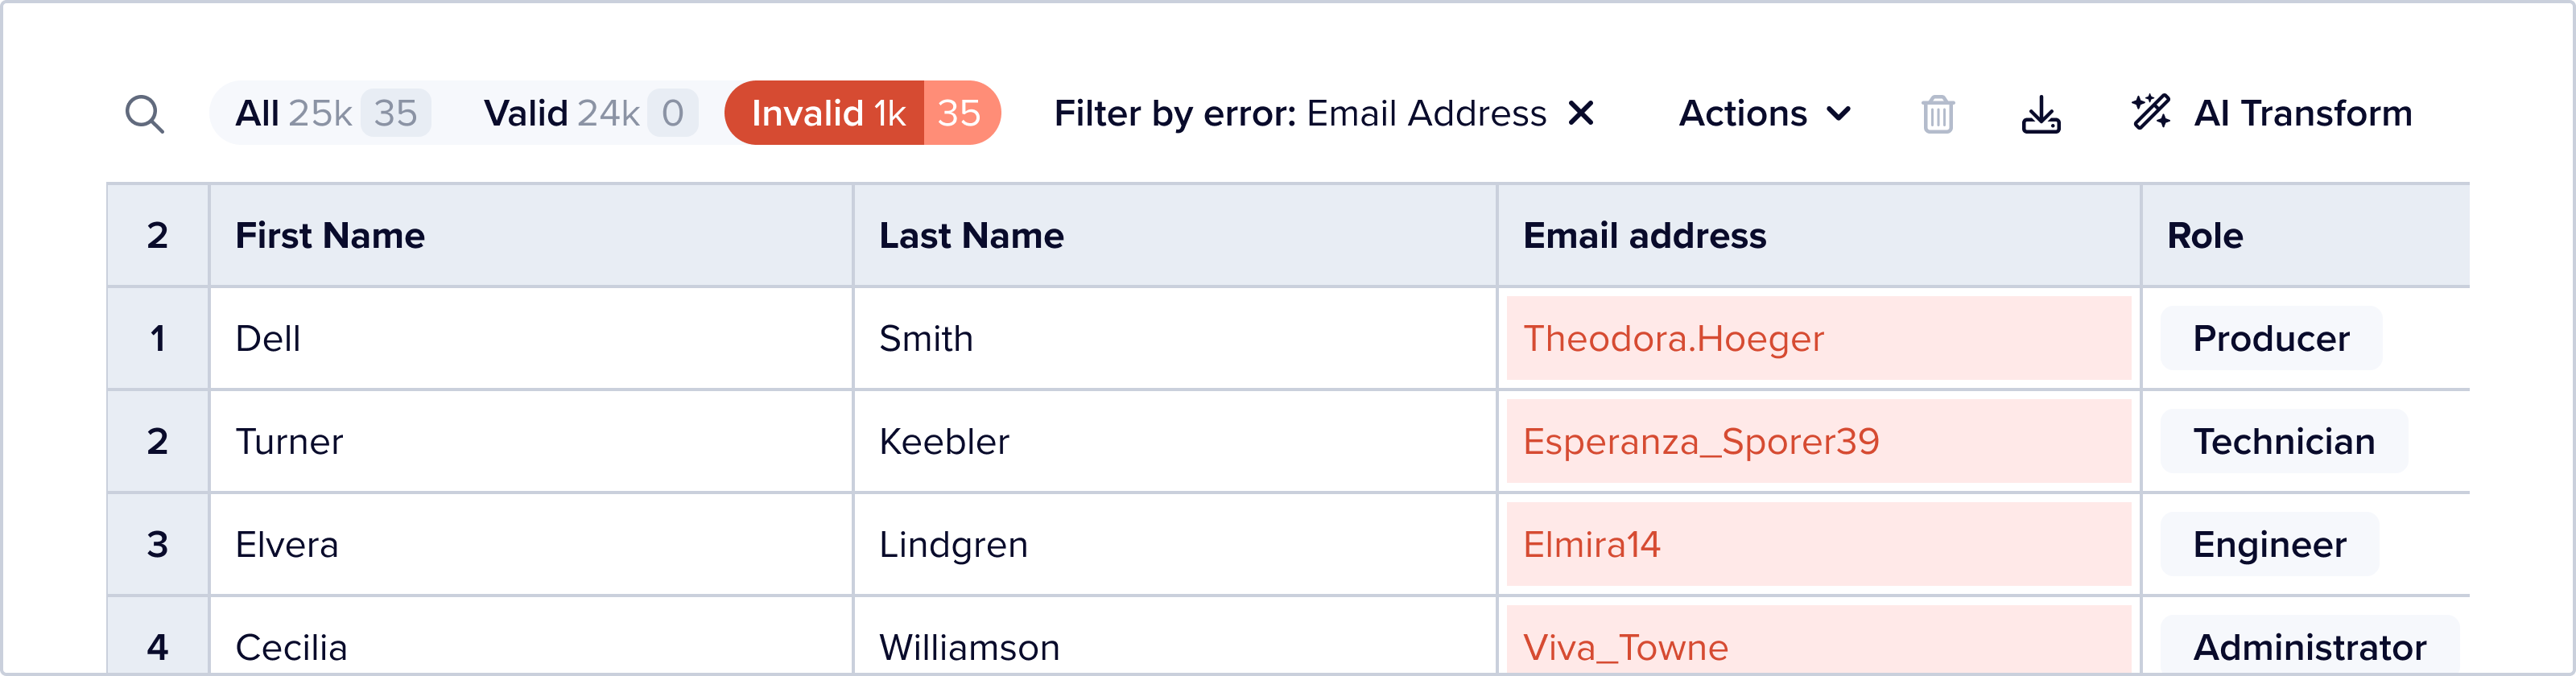
Errors are highlighted in red and accompanied by configurable error messages that describe what’s wrong. The example below shows what a user sees when they hover over a cell with an error on it:
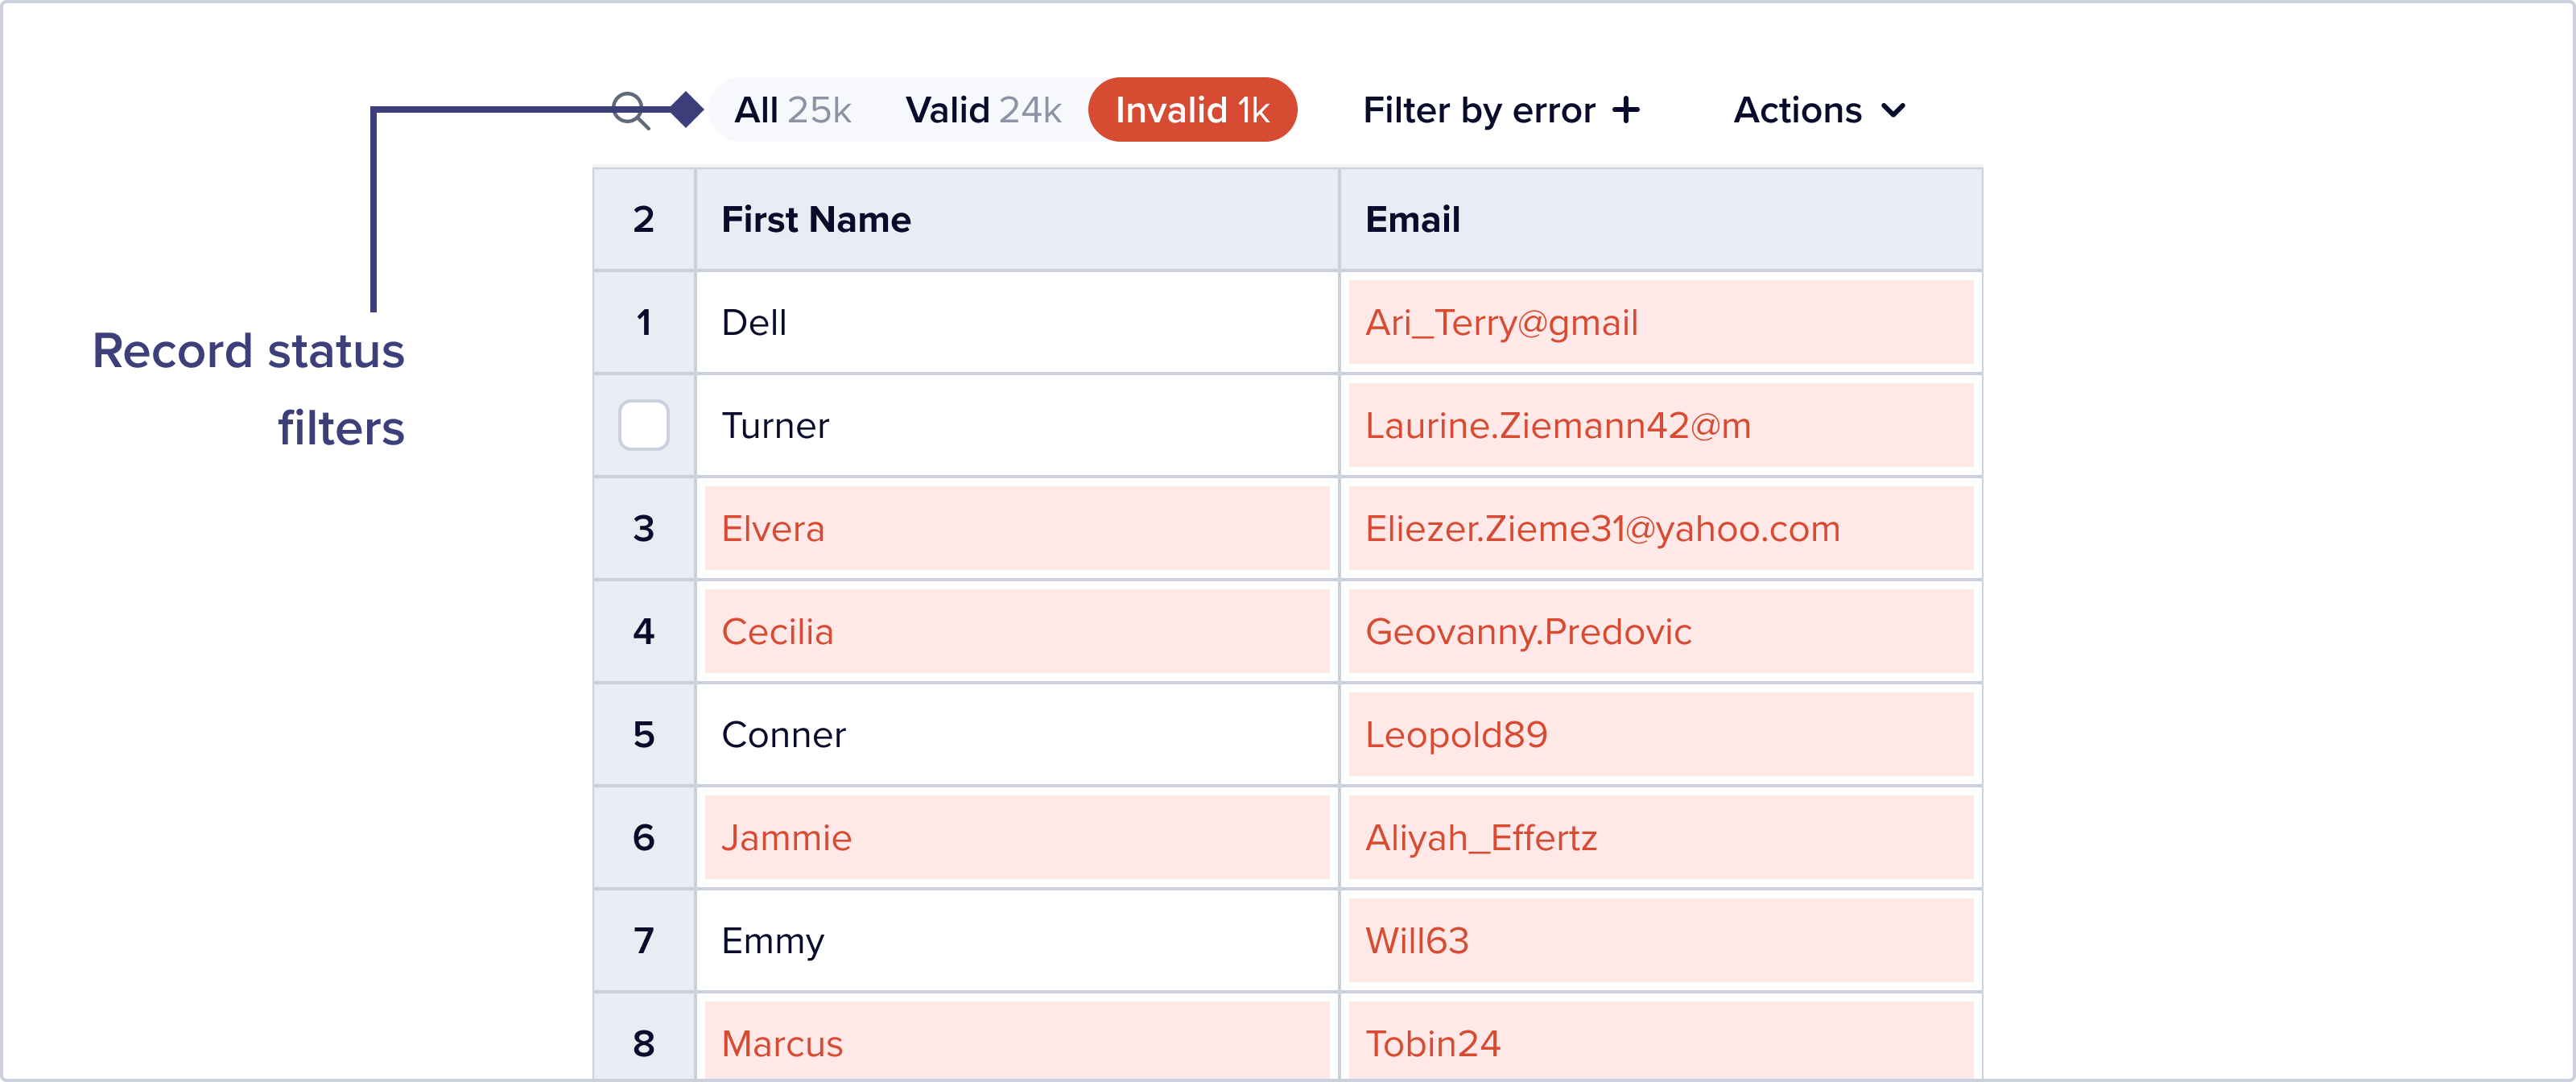
It’s very easy to filter any dataset to just show records with errors, using our record status quick filter:
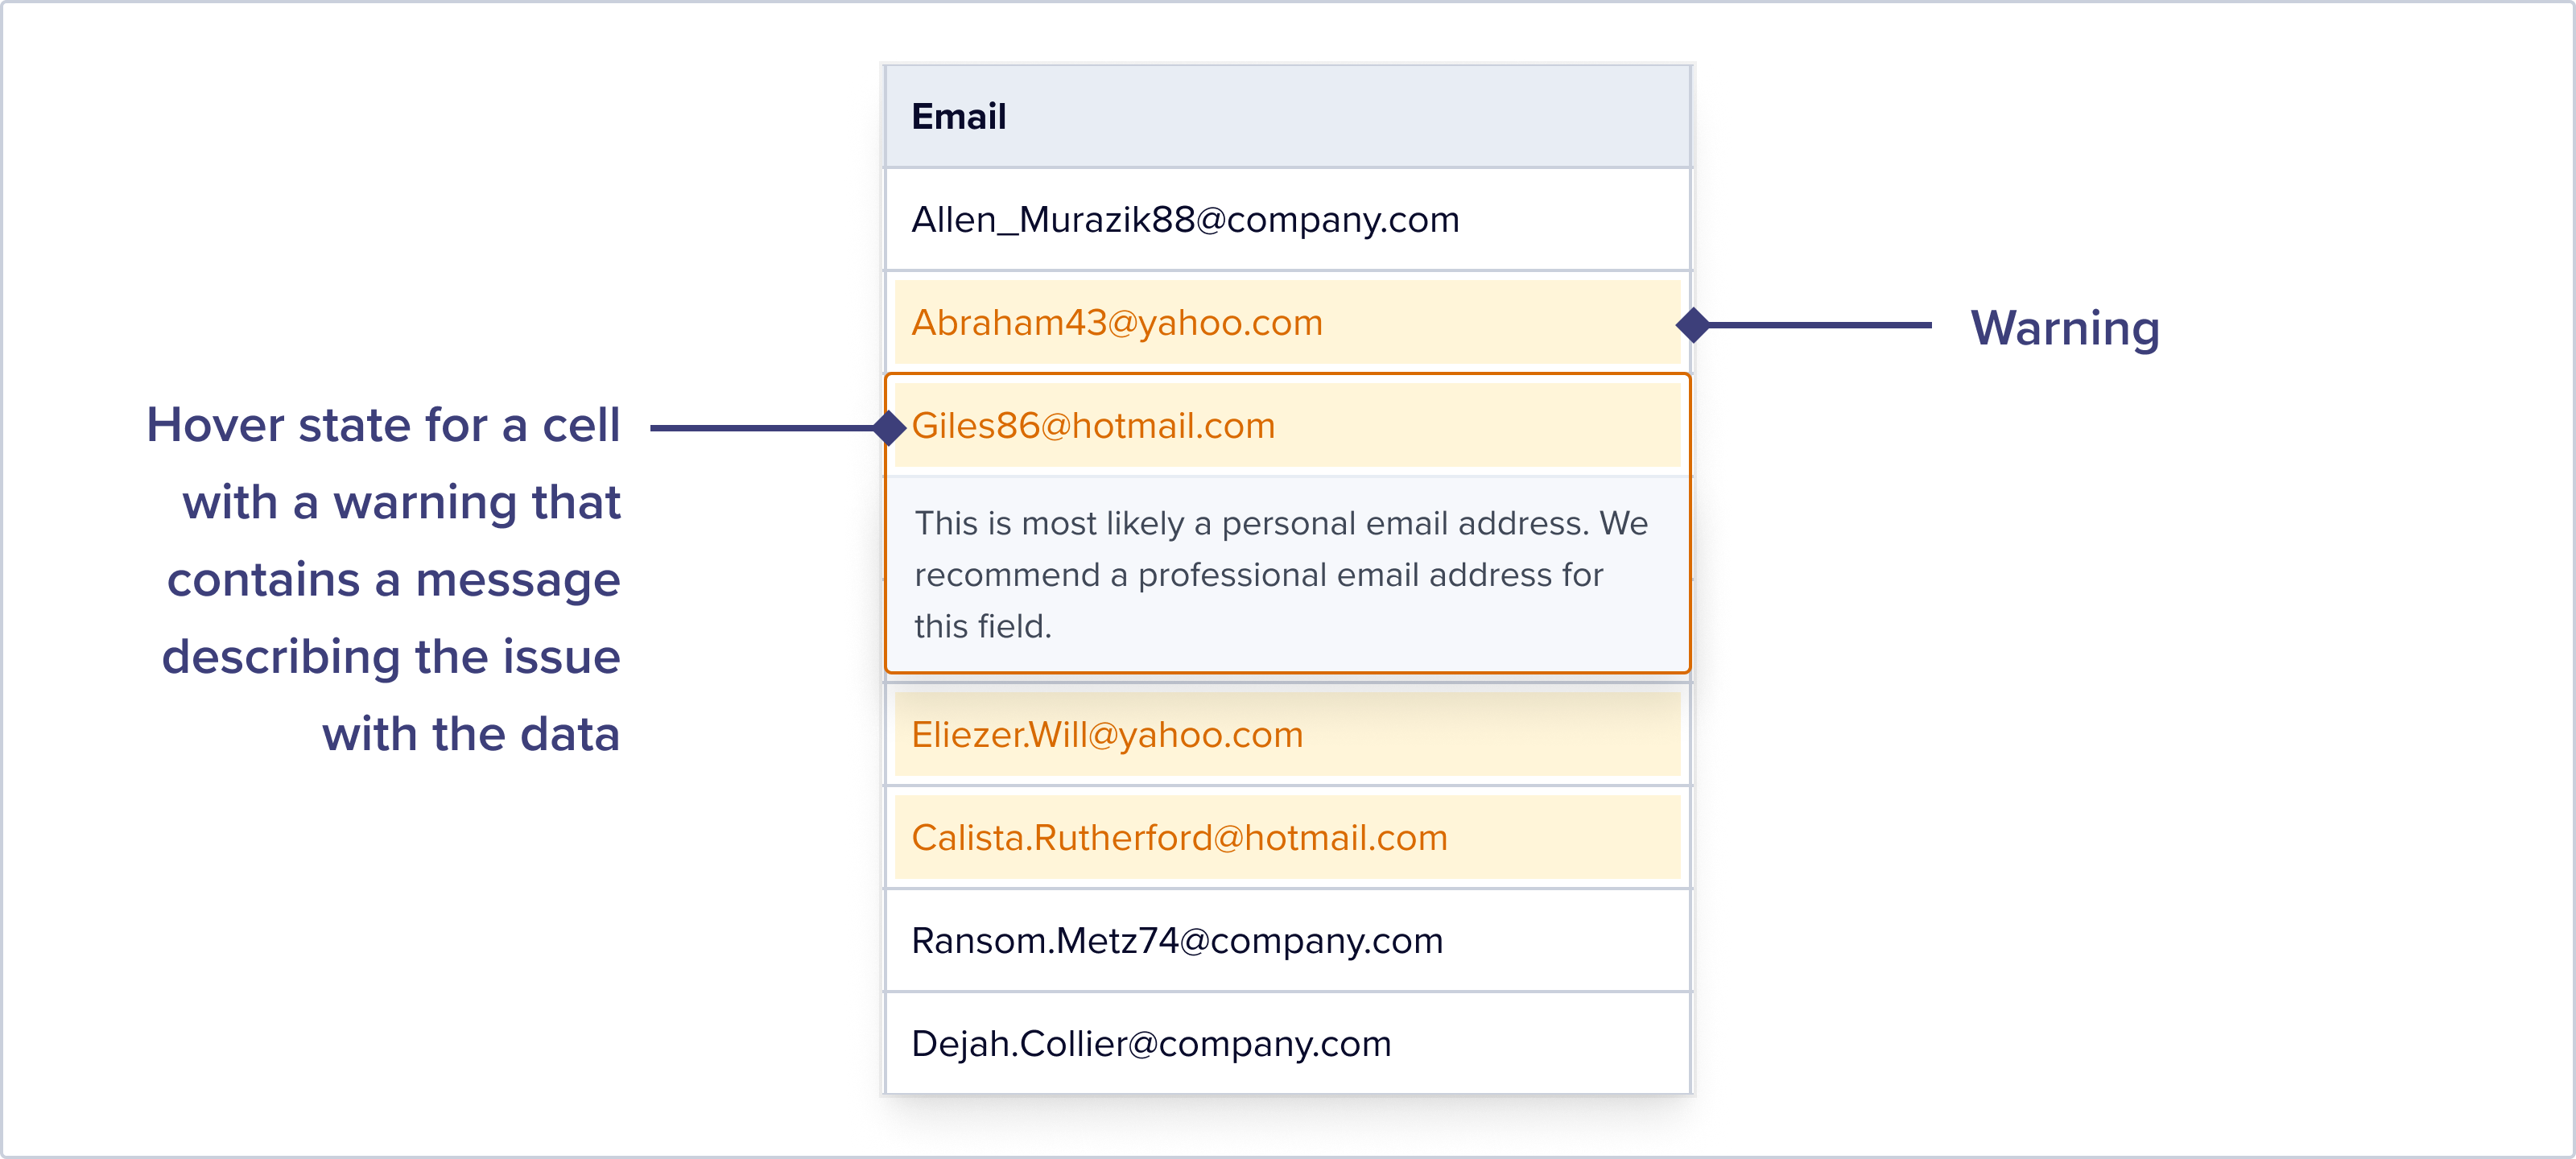
Warnings
Warnings are highlighted in yellow, and do not show up when you filter the dataset to just show records with errors. It’s best to use Warnings to draw users’ attention to potentially problematic data that is perhaps less important for them to resolve.
Automatically Modified Data
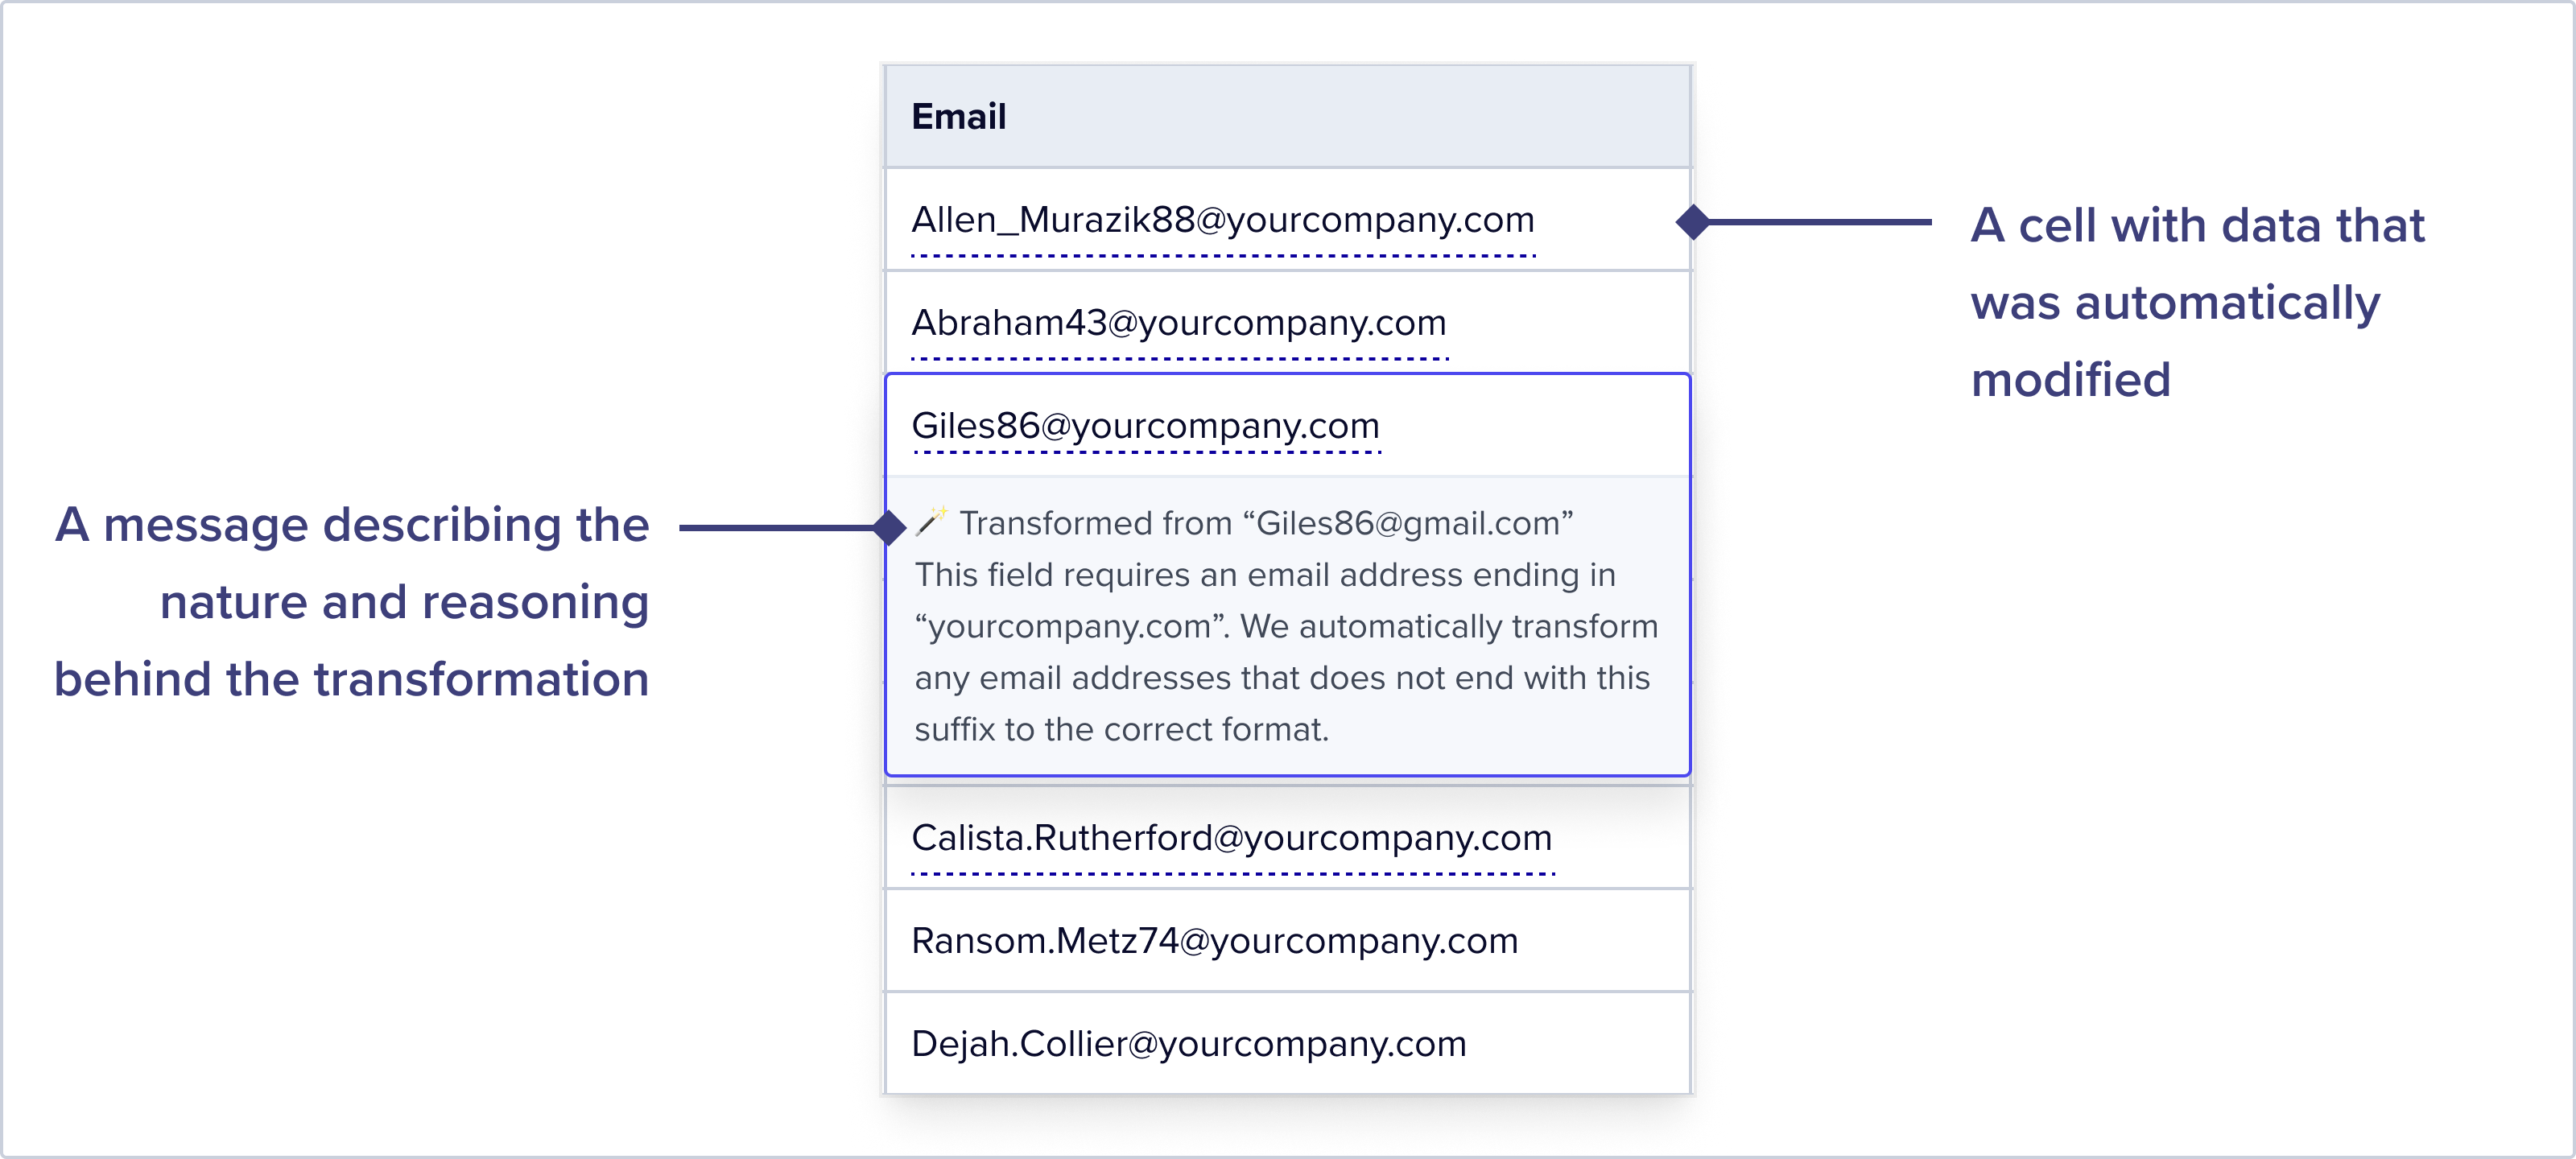
Another way our customers make data review and correction easy for their end users is by deploying custom logic that automatically transforms incoming data to correct it using Record Hooks. But it’s really important for end user to be able to see what data was automatically transformed, so they can correct it if the automated transformation was insufficient in some way. We encourage our customer to configure Record Hooks with a short description of how and why data was transformed.
Here’s how Turntable highlights automatically modified data to end users:
Filtering Data
Record Status Filter
Earlier, I referenced the record status quick filter. This is a quick filter optimized to surface records based on whether they are valid or invalid. This button group shows counts by status – it’s a great way to get a high level of view of the dataset. This makes it really easy for end users to find dirty data.
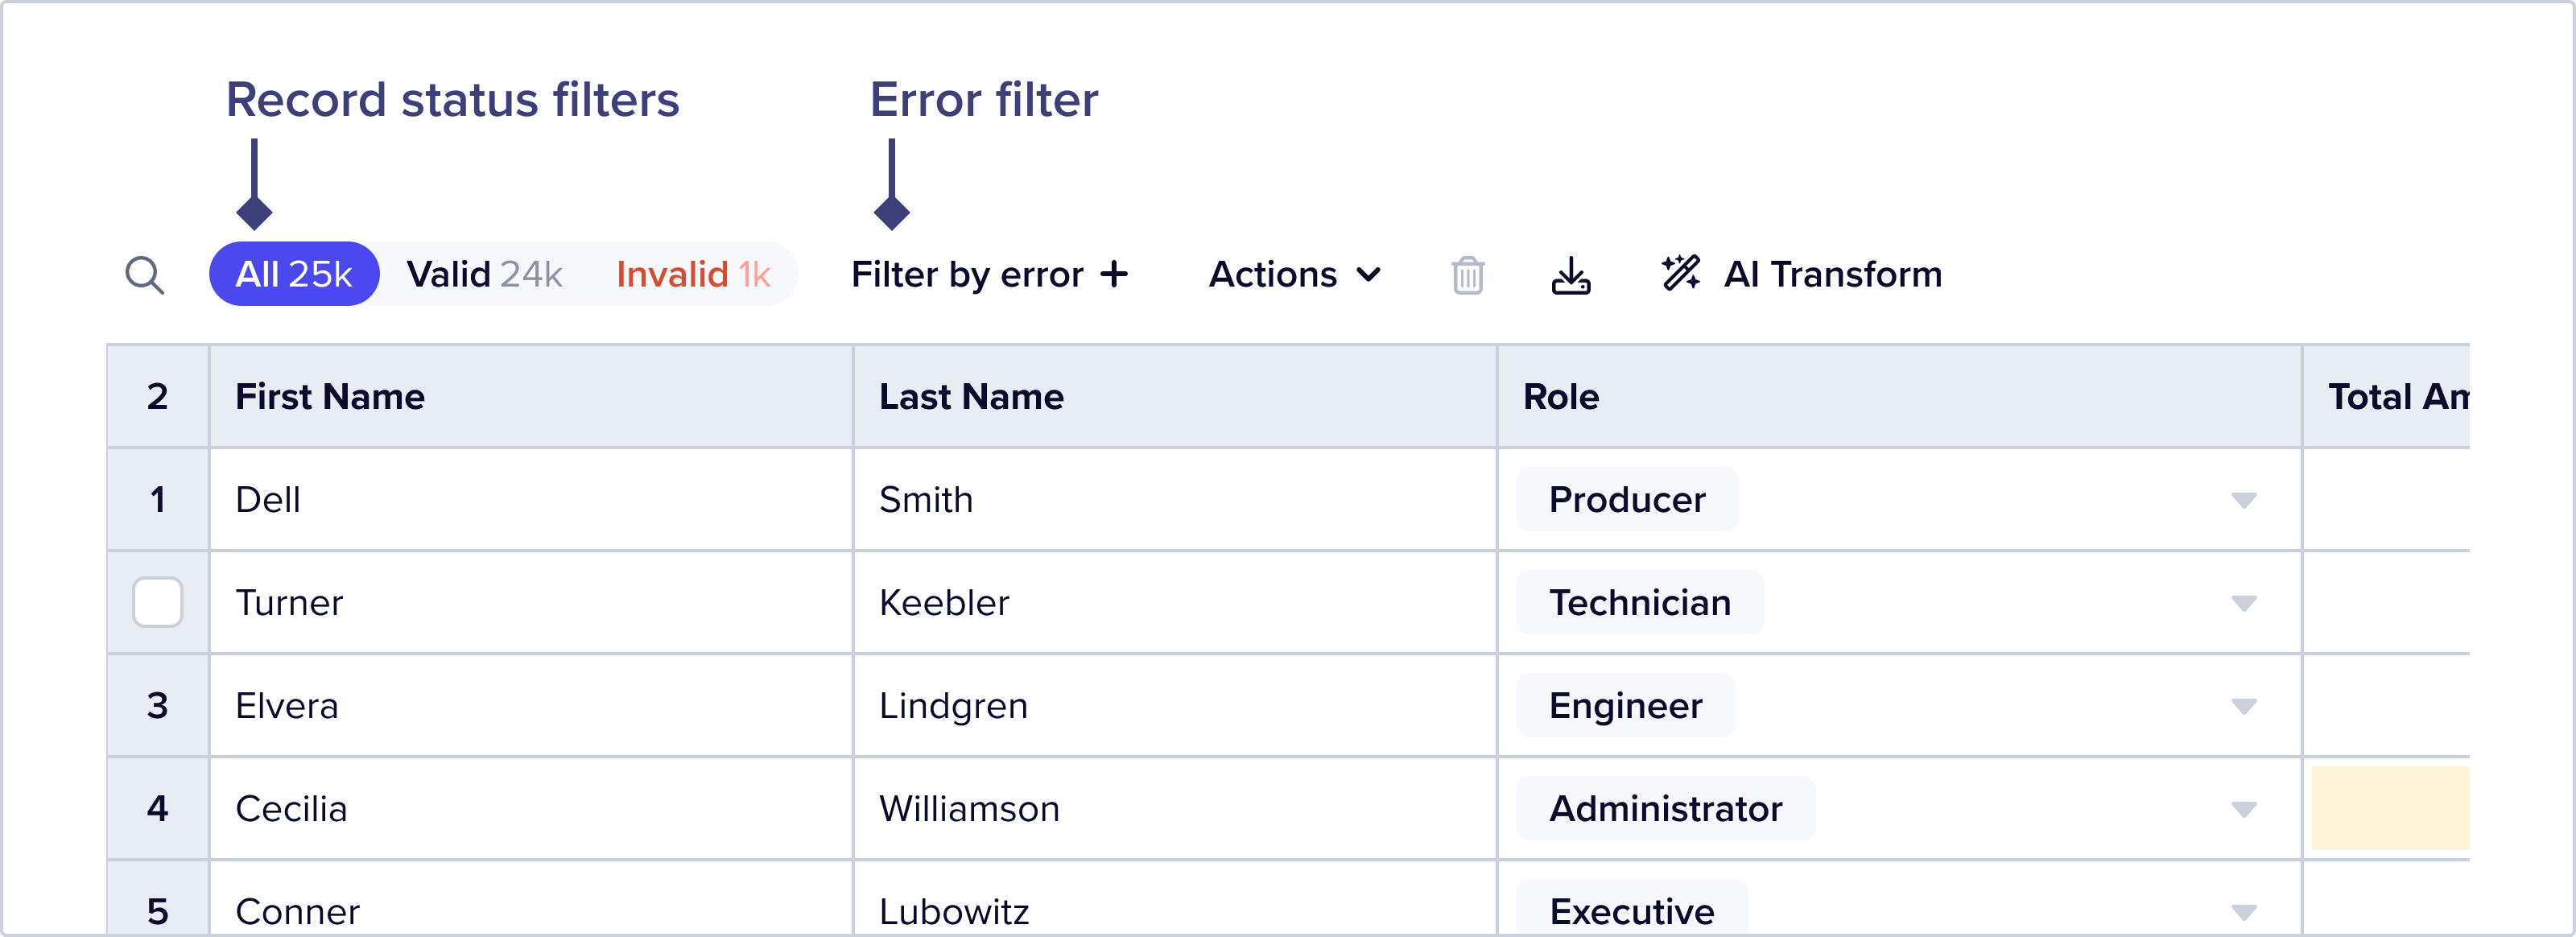
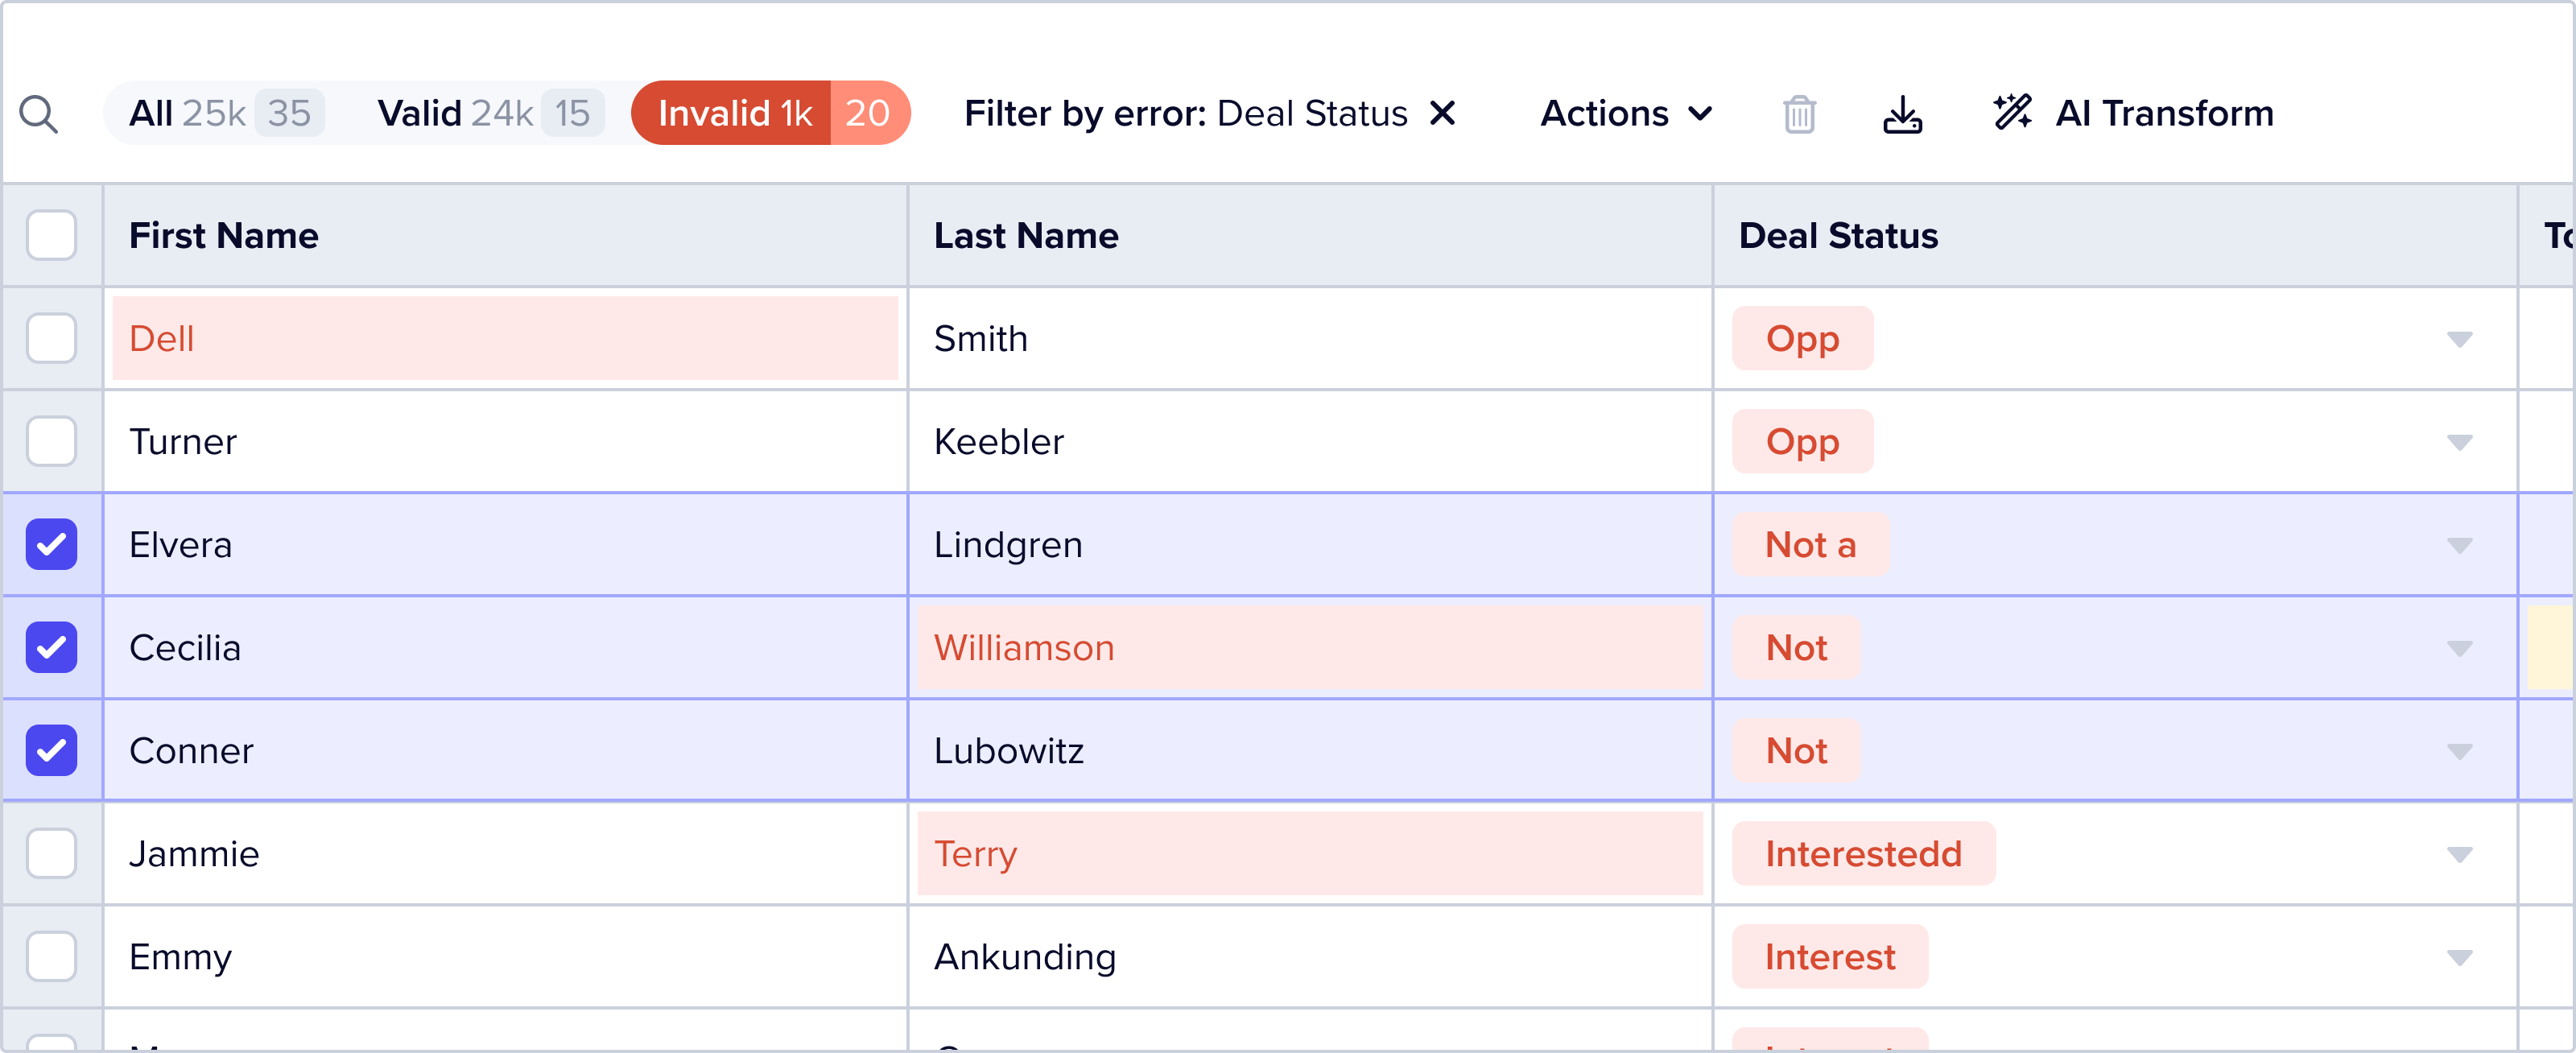
Filter by Error
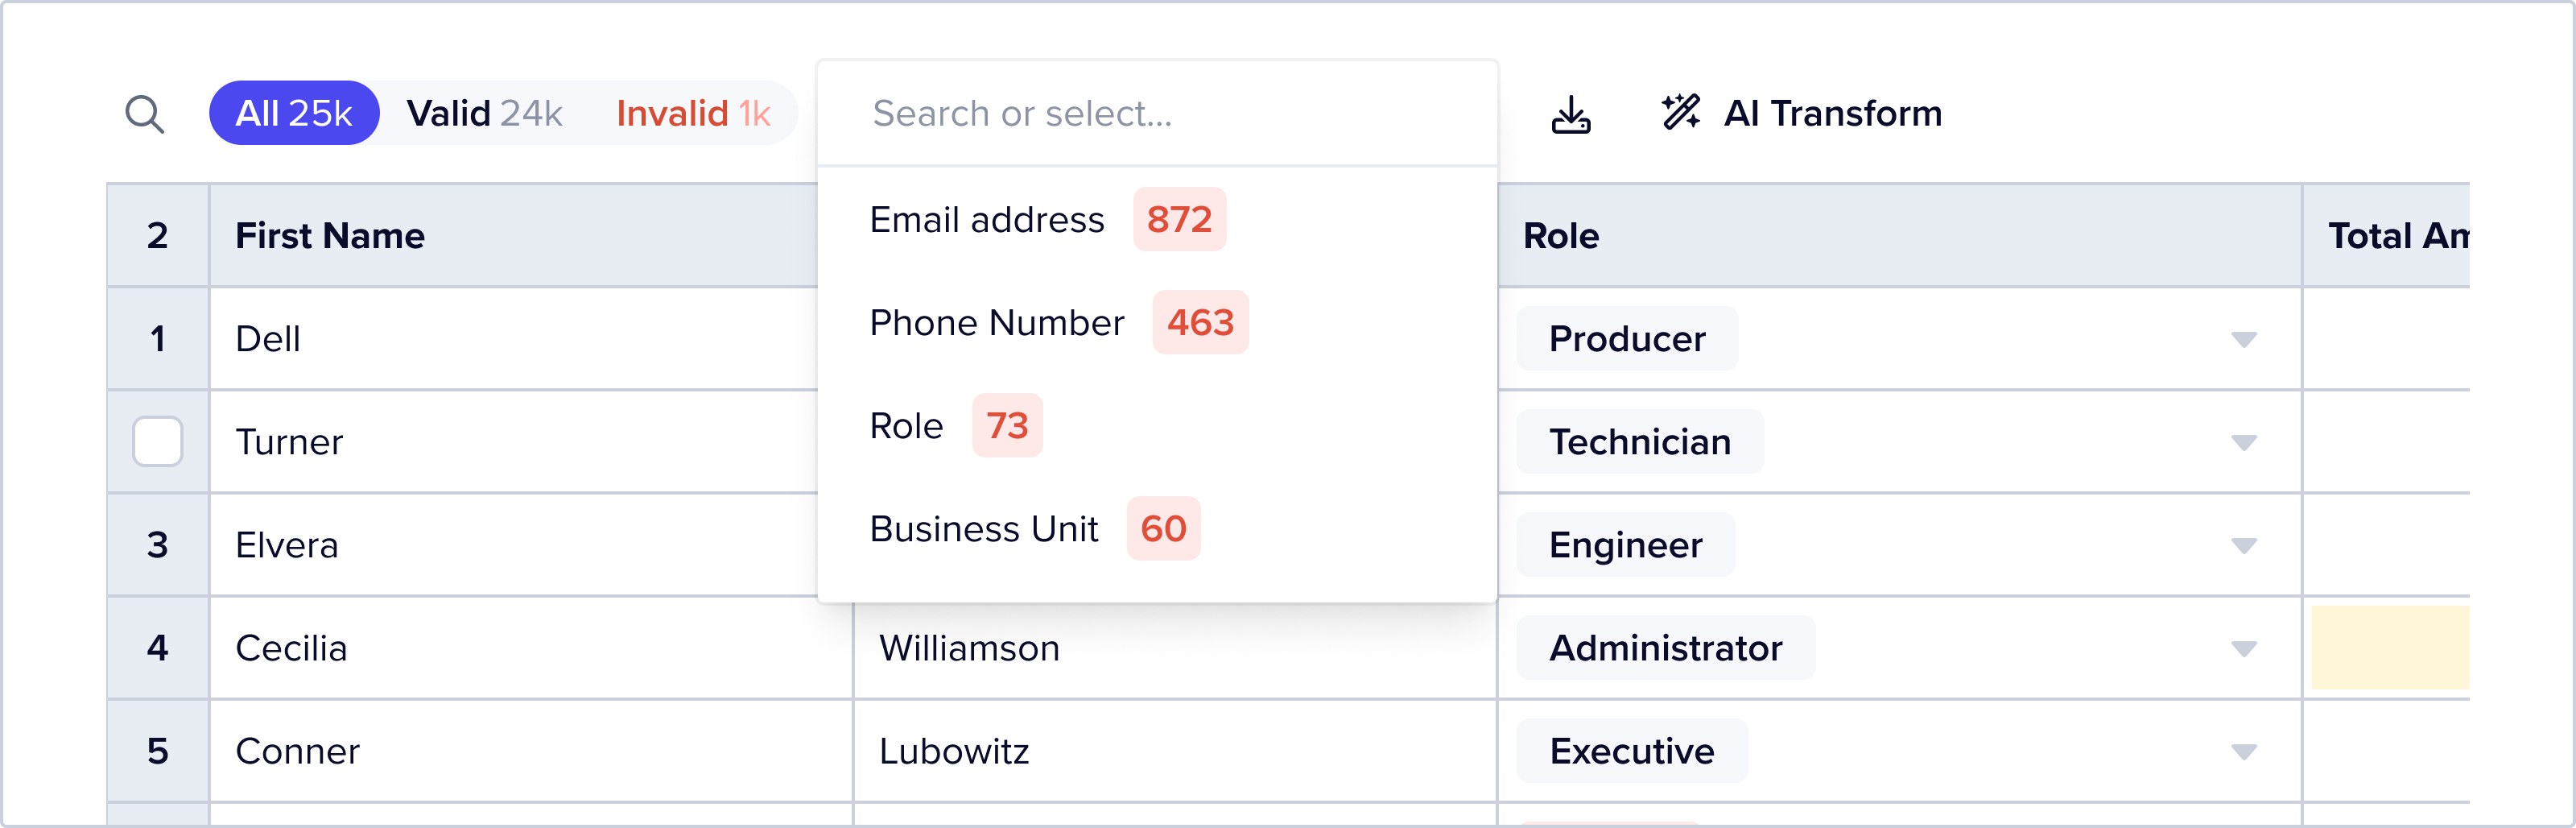
Users can also further filter data by using the filter by error feature. Clicking this opens a dropdown that offers a list of field names – selecting a field name will filter the dataset to records that have an error on that field.
The Record Status button group updates counts to show both “all” and “filtered” counts by status:
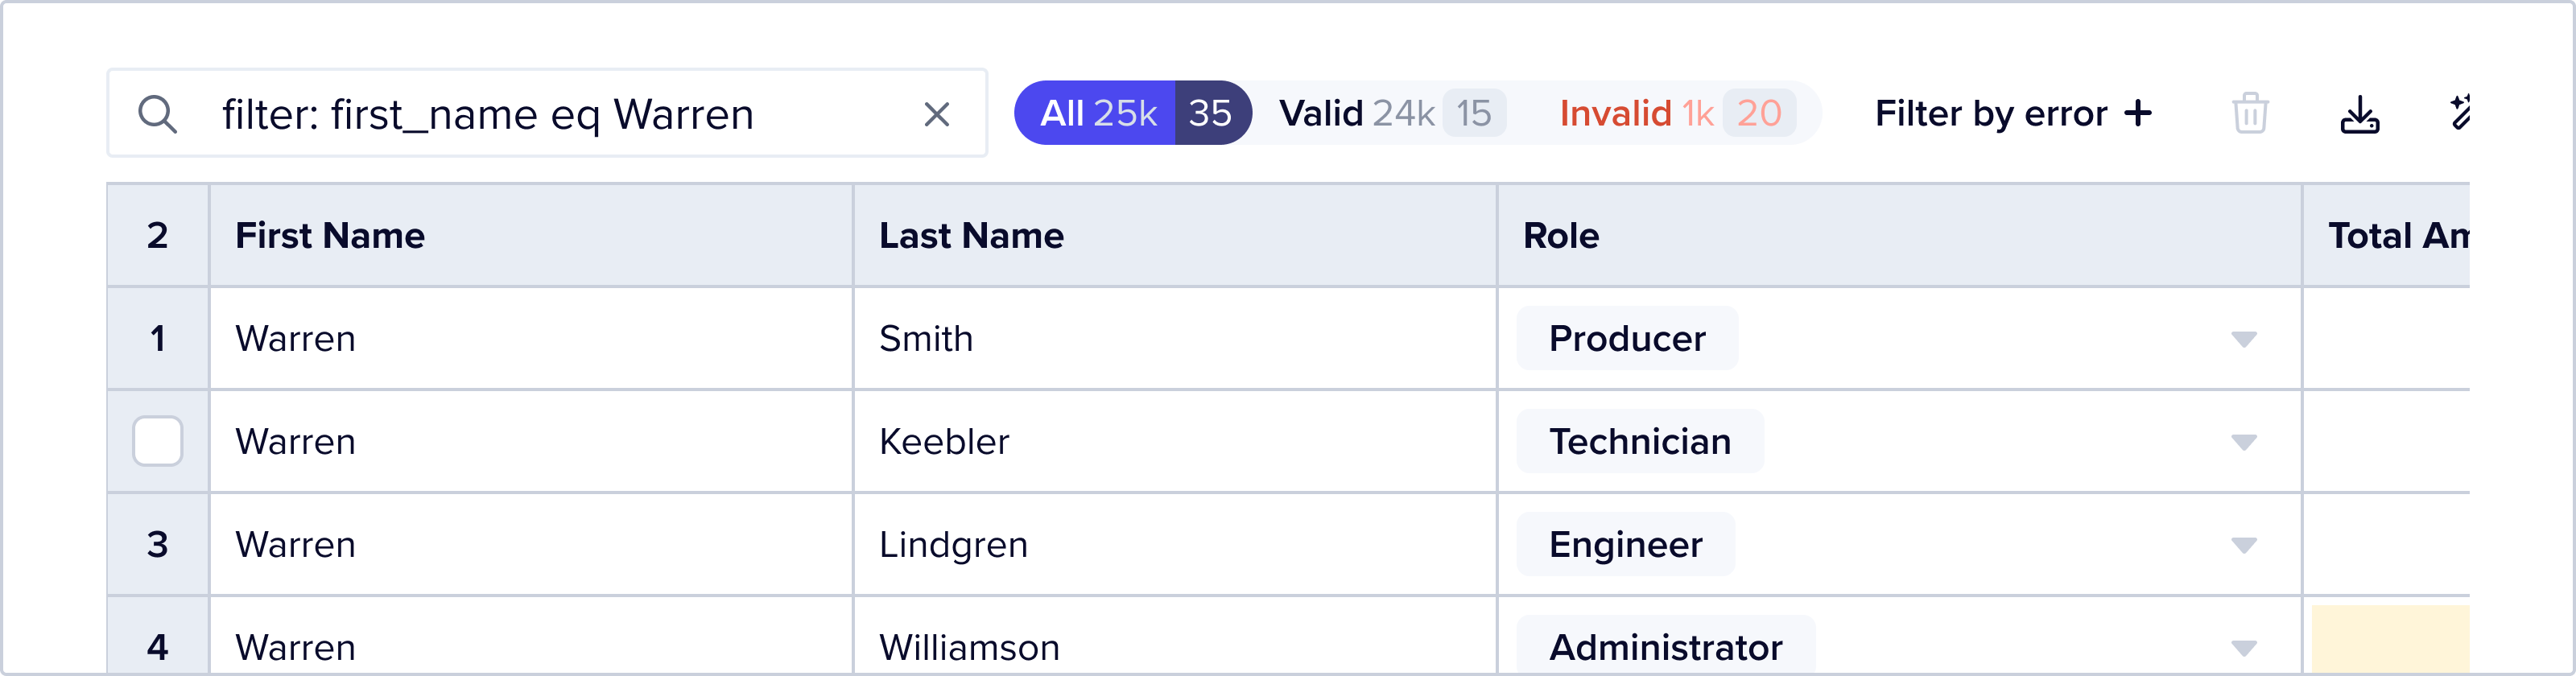
Filter with FFQL
Users can also filter data using FFQL, a simple querying language that allows you to string together a series of AND and OR statements to filter a dataset down to far more specific criteria.
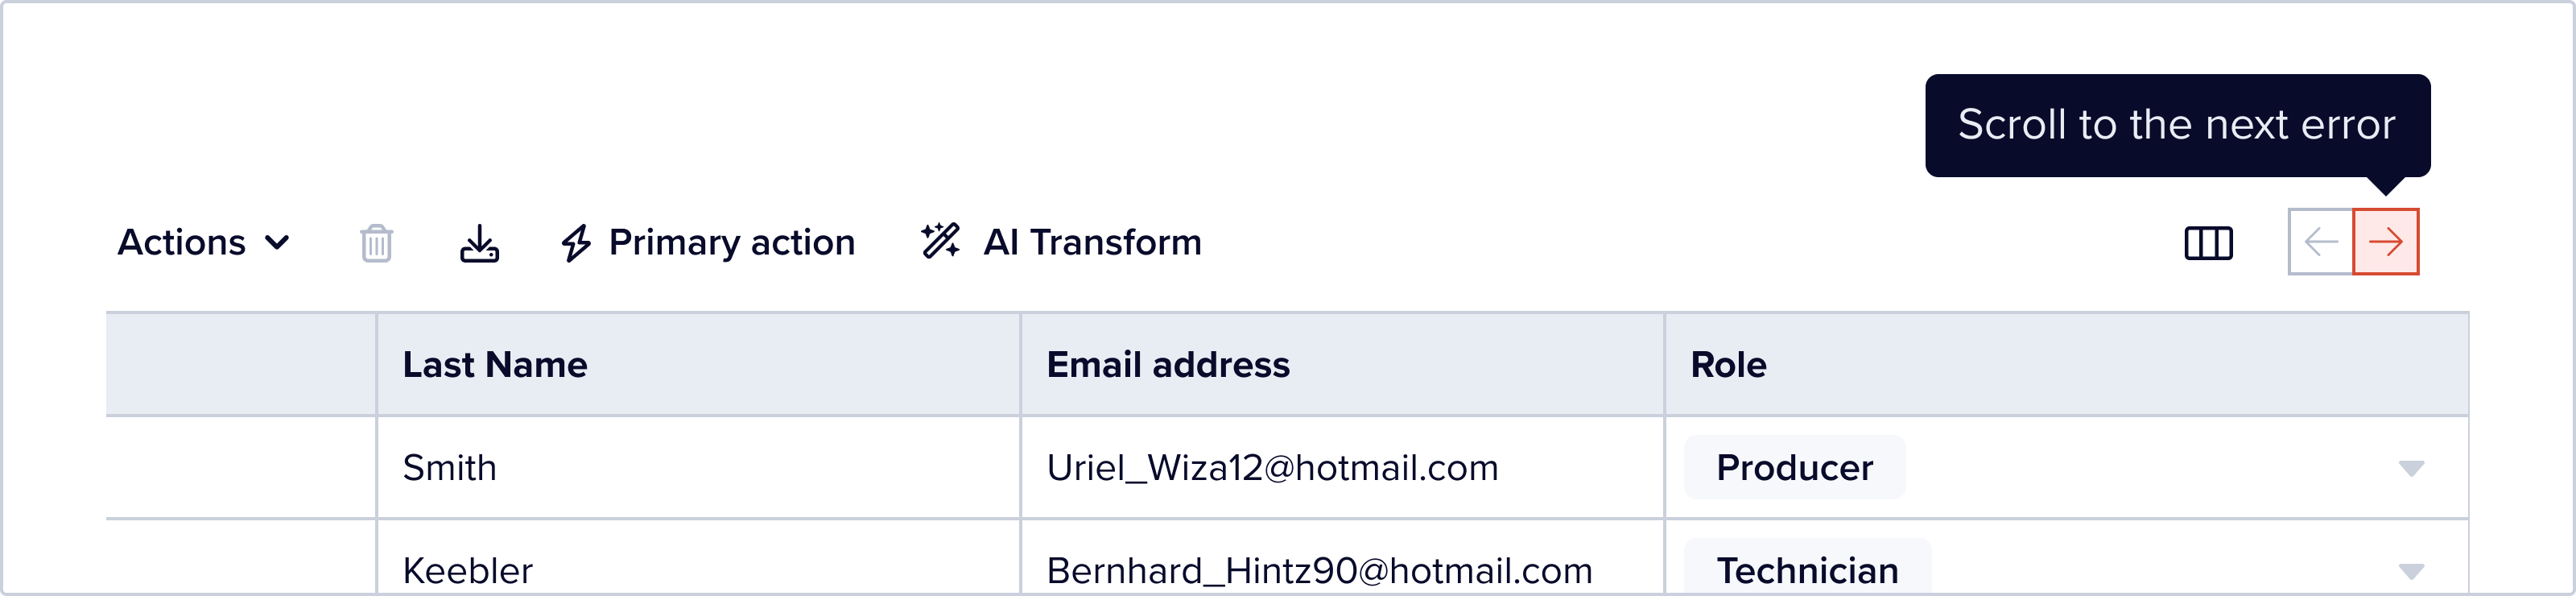
Sometime the cells that errors on them aren’t on screen. User can click on the “scroll to next error” button to the top right of the table to horizontally scroll to the next column that has records with error in them.
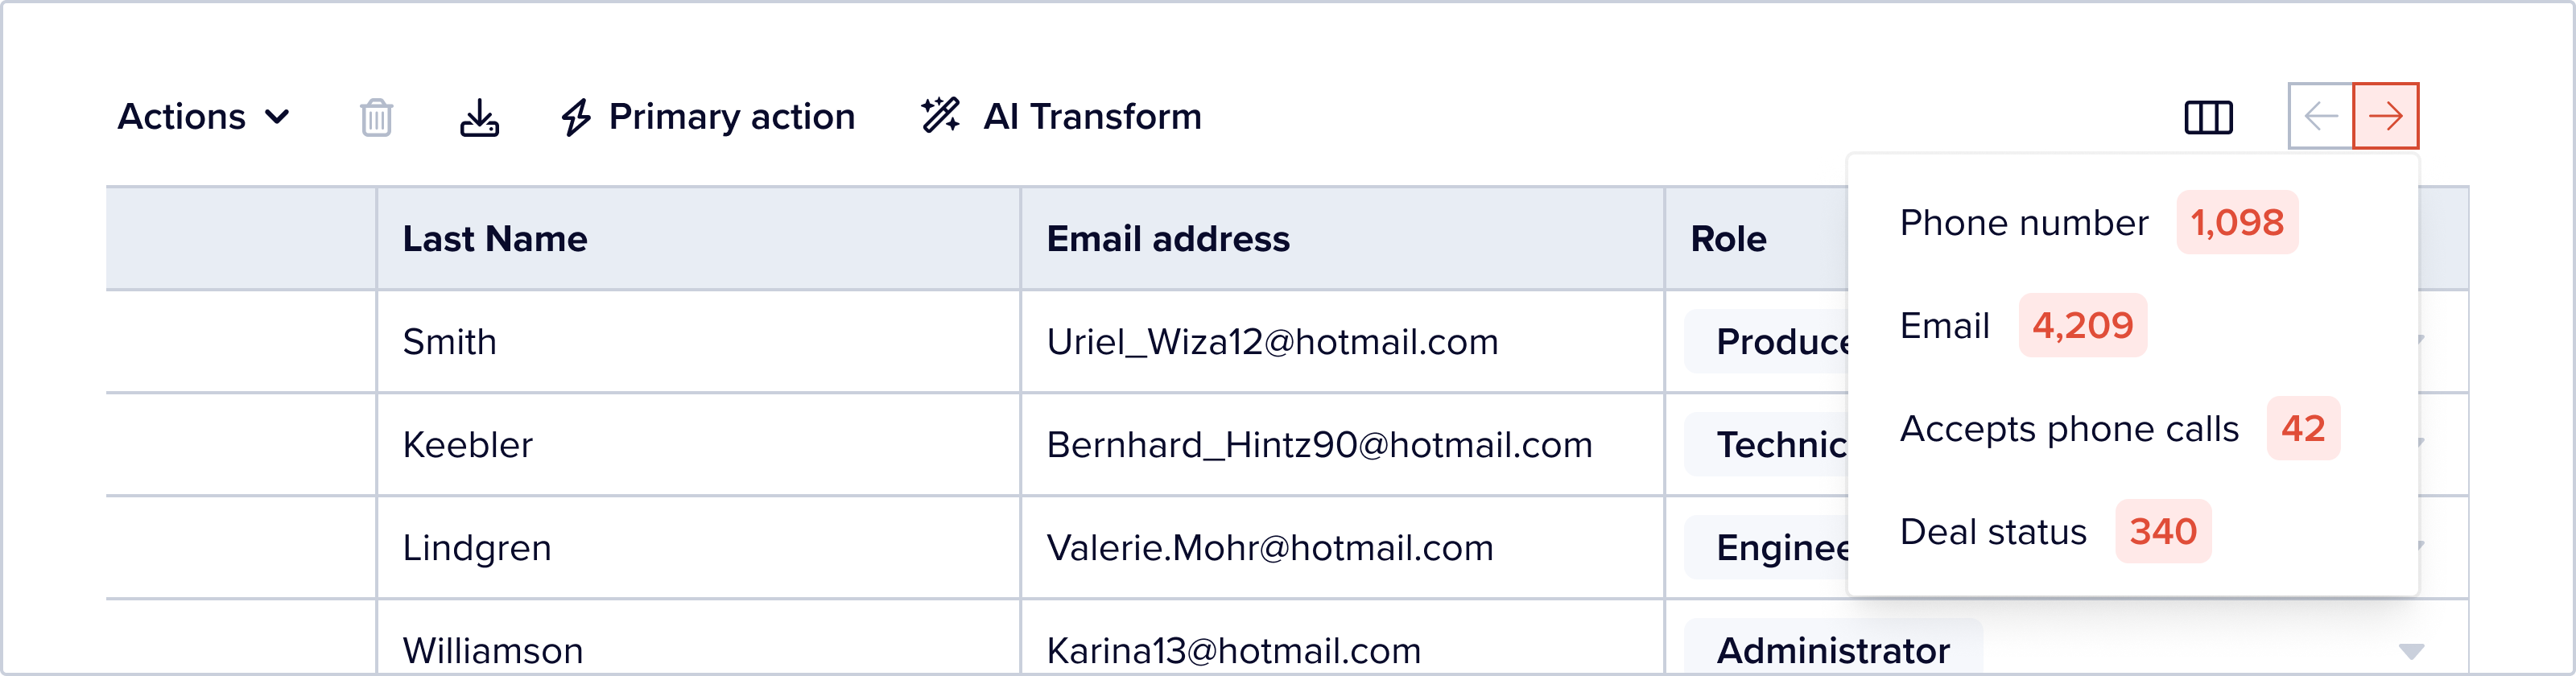
On right click, users can see a list of columns with errors and select one to quickly scroll to.
Bulk Resolution of Errors
When you have a small dataset with a small number of errors it’s fairly trivial to go in and edit cells one by one to fix your data. But many of Flatfile’s users are uploading datasets with many thousands of records. And absolutely no one wants to correct thousands of errors manually.
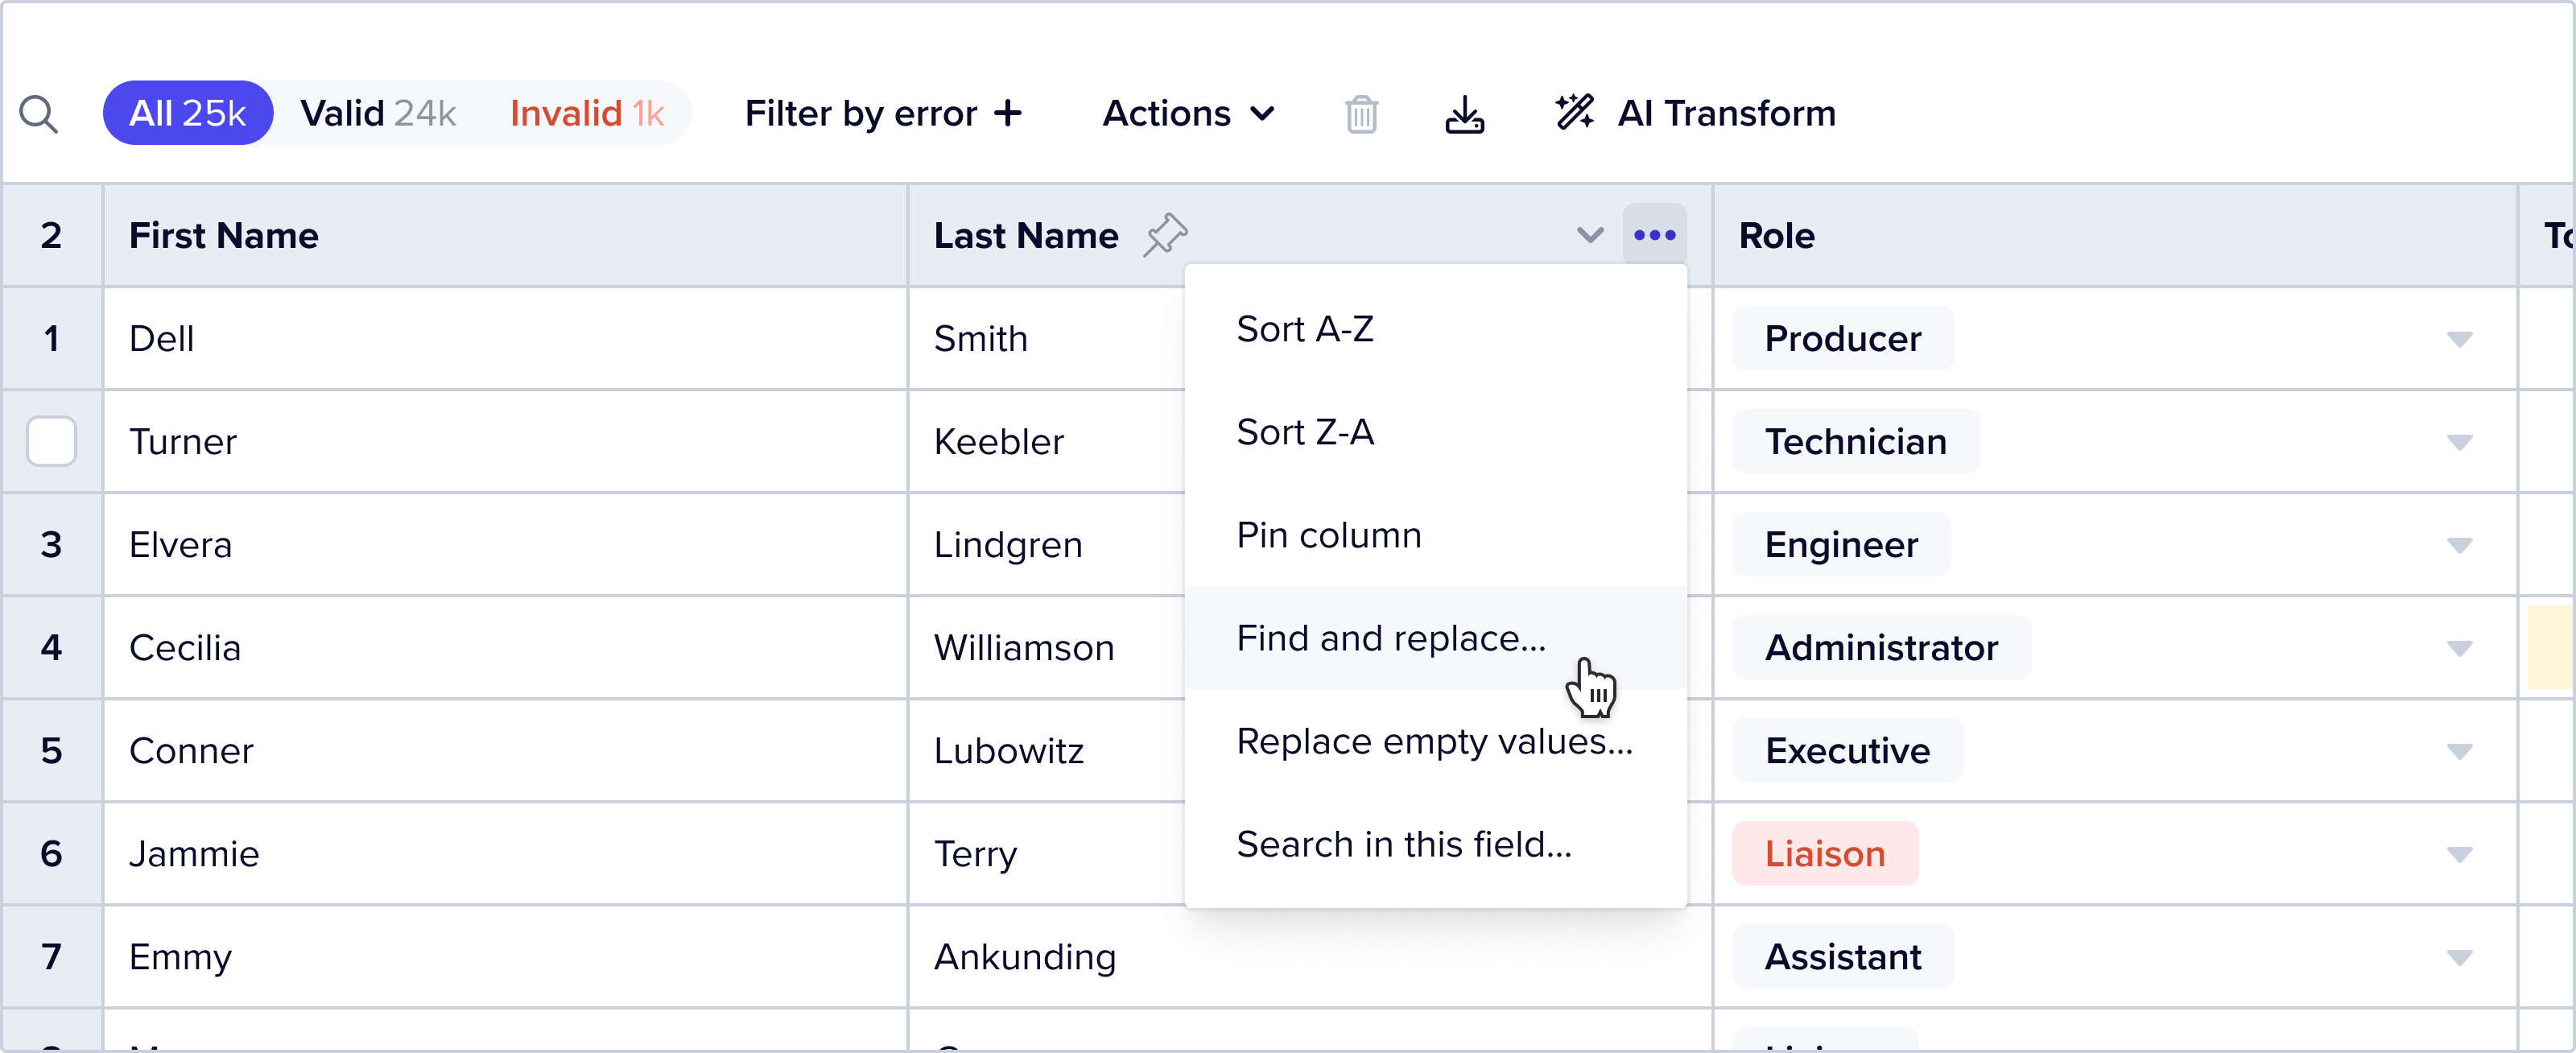
Flatfile offers a few out of the box features for bulk resolution of common errors – find and replace and replace empty values. You can find this functionality by clicking on the column context menu – a three dot icon that appears when you hover over a column header:
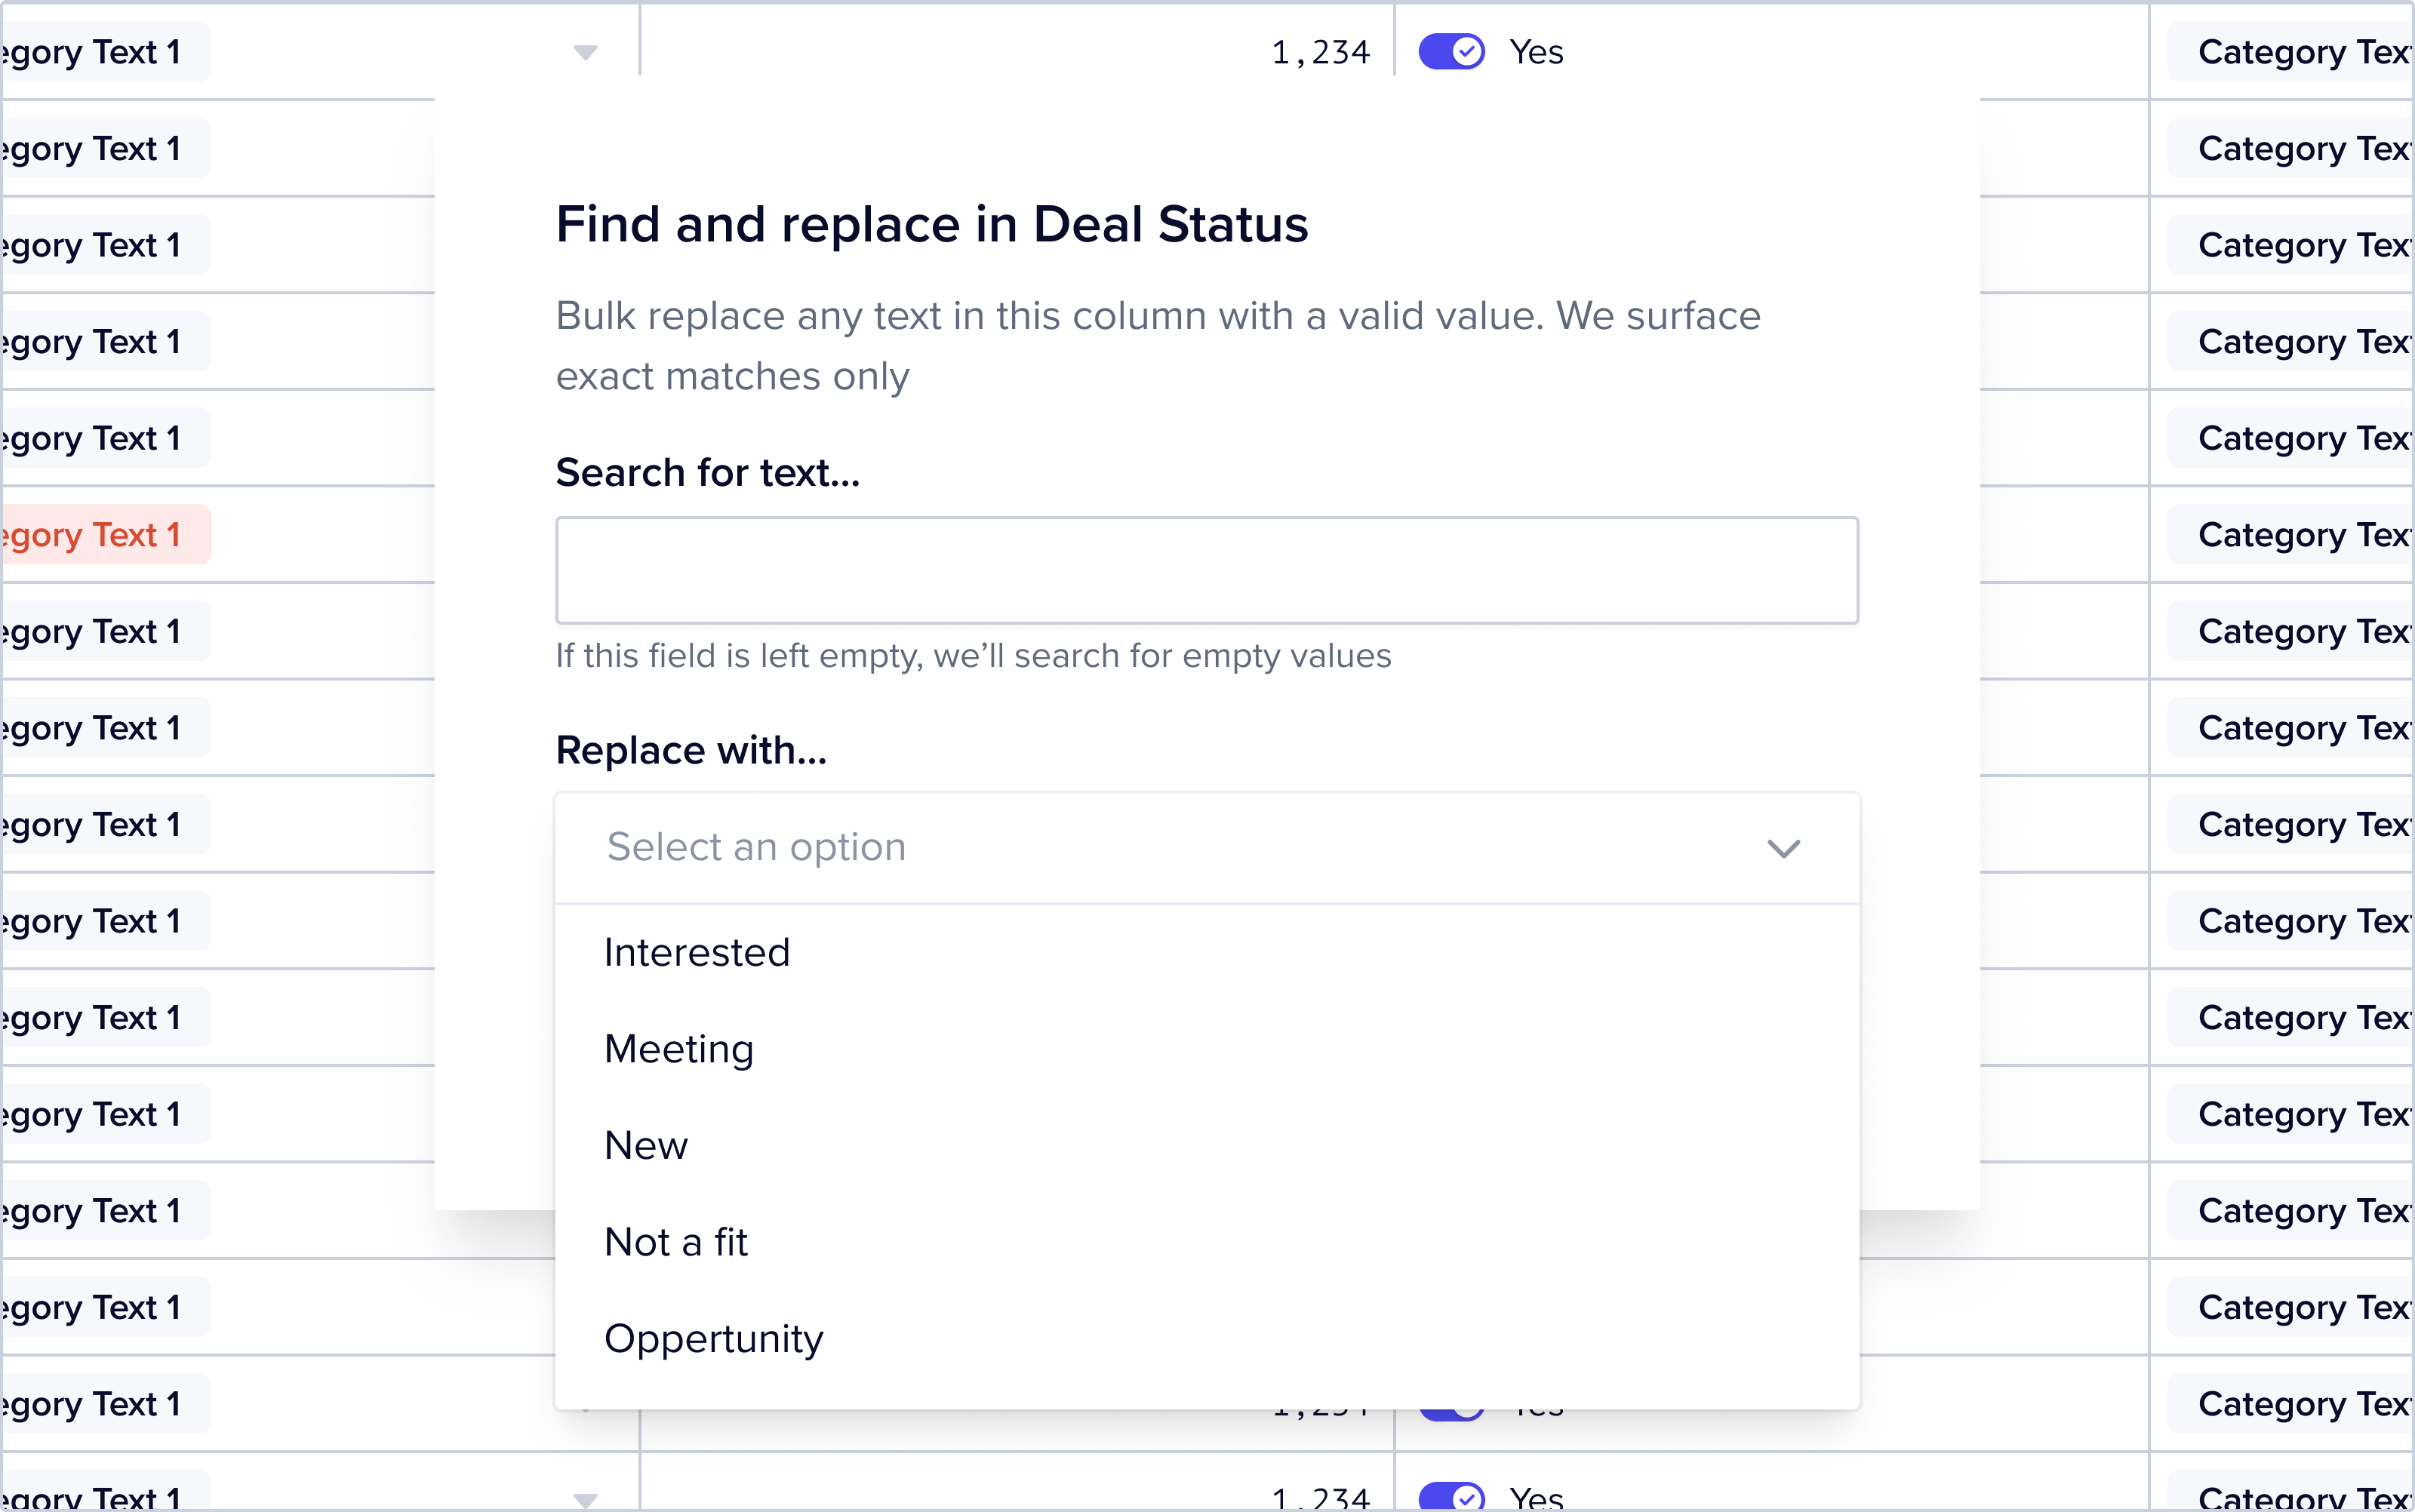
Both find and replace and replace empty values are restricted to the column from which they are triggered. We have also encoded additional guardrails based on data types. For example, if you trigger find and replace from a categorical data type field, we limit the “replace” options to only the valid option encoded into that field in the Blueprint. This prevents a user from accidentally introducing new errors when using a bulk action.
Here is an example of the available “replace” options in a find and replace triggered from a field named “Deal Status” for which the encoded valid options in the Blueprint are “Interested”, “Meeting”, “New”, “Not a fit” and “Opportunity”:
Similarly, if you trigger find and replace from a numerical field, the only accepted inputs are numerical values. For boolean fields, you must choose from one of the two encoded boolean values.
We do not offer these features on fields that have been configured with a “unique” requirement, since it would make no sense to bulk replace cells with identical values that would break the “unique” rule encoded into the Blueprint. (Note: I don’t think this is true right now and we should fix this)
For example, if you know that your customers often bring in a column that contains full names but your blueprint wants a First Name and Last Name in two separate columns you can configure a “Name Splitter” action that detects if either of your configured blueprint fields, “First Name” or “Last Name” contain a full name, and if so, to split the name and place the first name in the “First Name” field and the “Last Name” in the last name field.
Combining Filters with Bulk Error Resolution Methods
Flatfile offers multiple ways in which a user can slice and dice data via the record Status quick filter, filter by error feature and FFQL. Users can select all data using our checkbox UI by clicking on the checkbox on the top left of the table, or more granularly select data by individually checking boxes.
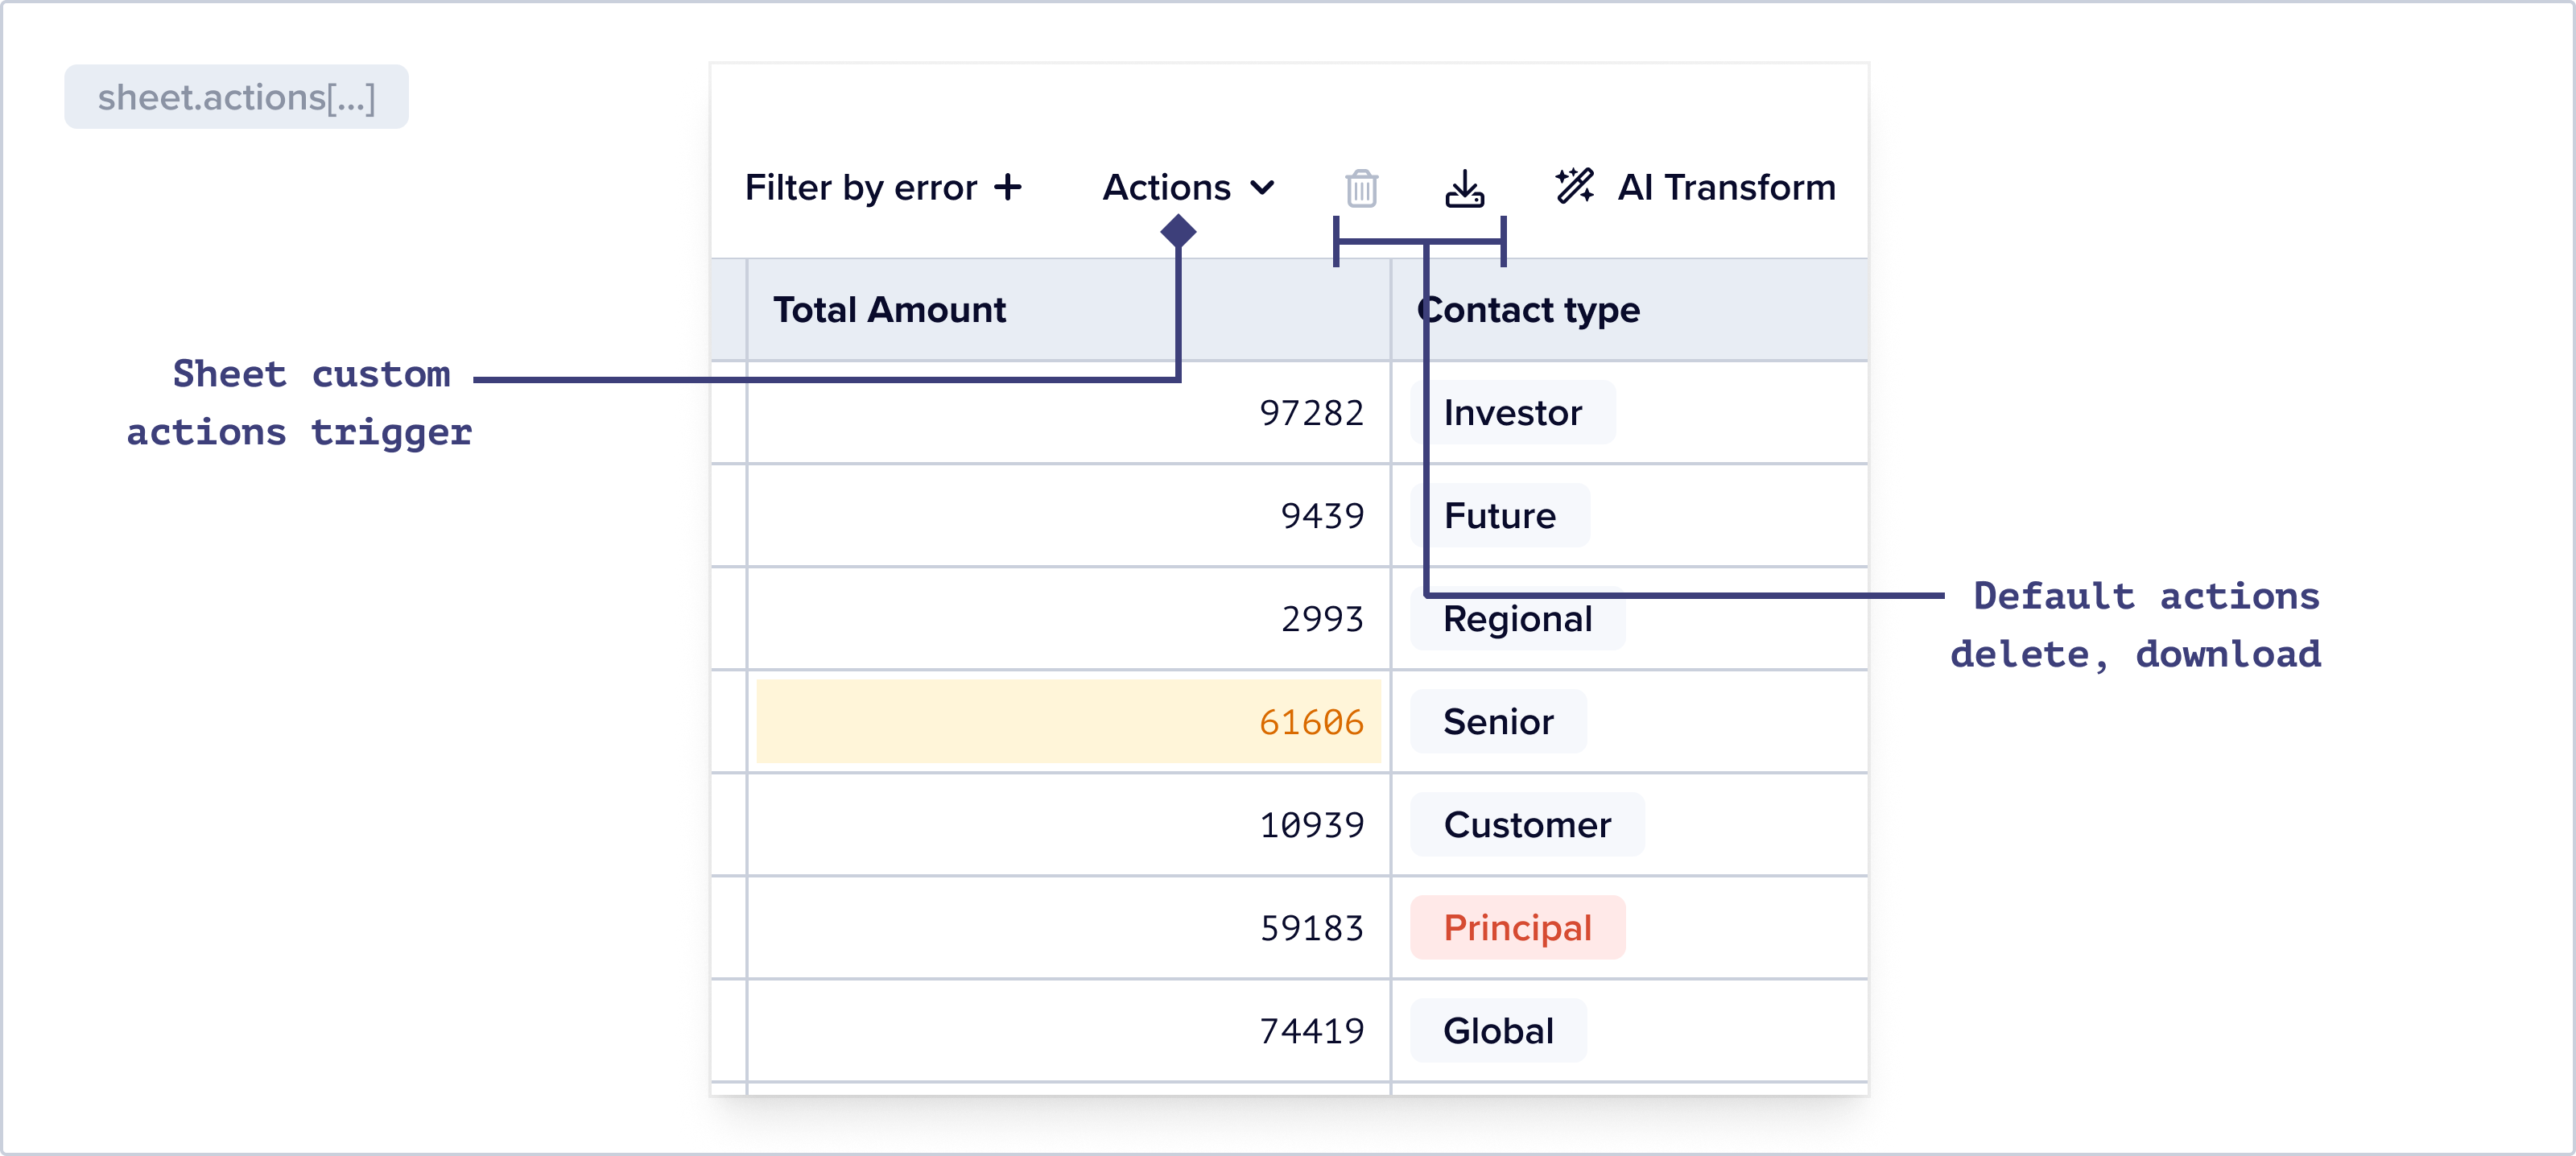
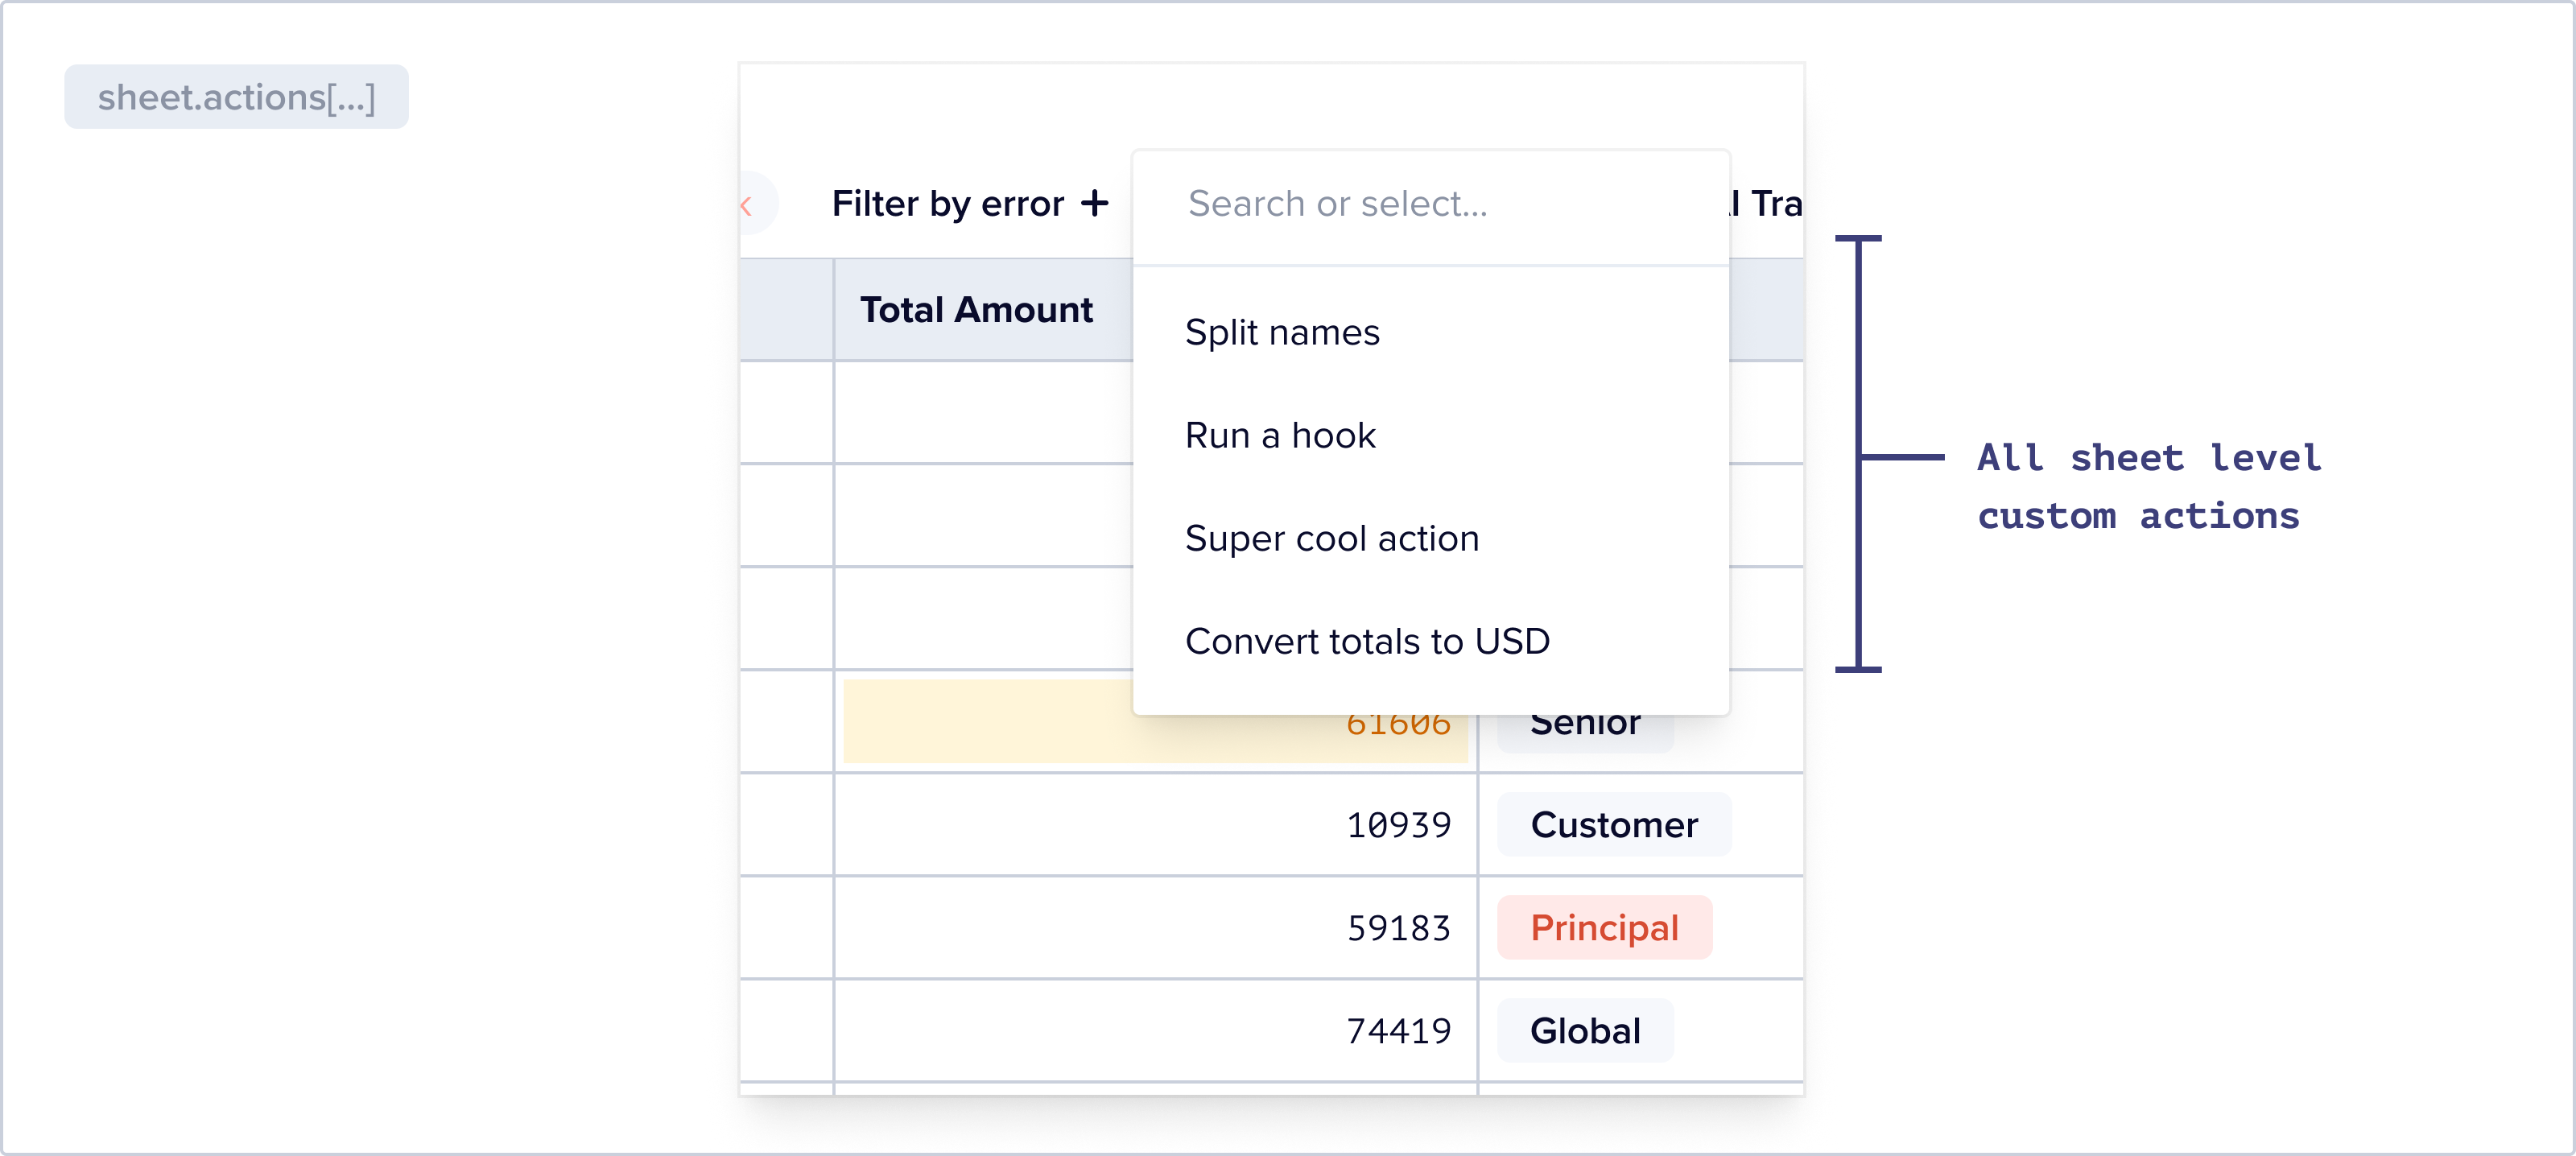
This can be a powerful tool when combined with the various methods for the bulk resolution for errors. Users can select specific data and then only perform either a default or custom action on that data.
AI Transform
Users can also use Flatfile’s AI Transform feature and to describe how they’d like their data transformed using natural language. Flatfile takes this prompt and generates and executes the code necessary to make the desired changes instantly across the entire data set.
Turntable then shows you a “diff view”, a view that allows you to more exactly see how your data changed — think a “track changes ” like UI but for tables. This allows users to determine if their data was transformed correctly before merging the change into their dataset.
Of course, there’s a lot more that goes into a great read-write table UX — I write about data table table stakes for here.
