A few months after I was thrown head-first into the weird, wonky world of structured finance as a data viz/data experience designer for dv01, I was tasked with designing and building a “securitization explorer” that would enable our users to easily peruse deals in the U.S. Consumer Unsecured debt space.
I knew only of the existence notorious of Mortgage Backed Securities, courtesy of the thousands of articles and books produced by journalists post financial crisis — and that was the extent of my knowledge of securitizations at the time.
I was lucky to be working with Frank Deutschmann, an industry veteran and then-head of product at dv01, who was all too willing to spend the hours needed to explain to me in very plain terms what I needed to know about securitizations.
My version of “Feynmanning”
I came across this excellent Richard’s Feynman quote on Slate Star Codex, in which he explains how his brain works:
I had a scheme, which I still use today when somebody is explaining something that I’m trying to understand: I keep making up examples. For instance, the mathematicians would come in with terrific theorem, and they’re all excited. As they’re telling me the conditions of the theorem, I construct something which fits all the conditions. You know, you have a set (one ball) -disjoint (two balls). Then the balls turn colors, grow hairs, or whatever, in my head as they put more conditions on. Finally they state the theorem, which is some dumb thing about the ball which isn’t true for my hairy green ball thing, so I say, “False!”
As SSC’s Scott Alexander noted, Feynman “was also good at using his non-mathematical intuitions to back up his mathematical genius.”
This technique of building a mental model to debunk a bad hypothesis or confirm a good one is often referred to as “Feynmanning”. My thought process for when I’m designing a new data visualization form is very similar.
When I am presented with information about how something works, I start with the simplest representation of the core concept and improvise add-ons as complexities emerge. As new information presents itself, I modify my viz to fit the new criteria. I test it to see if it fulfills all requirements as I go — does it still work in all possible realities within the limits of the criteria presented?
Rinse and repeat, until I have a visualization that fits all criteria and as many realities (i.e. real data, ideally) as I am able to test it against.
What is a securitization?
(Feel free to skip ahead to the next section if you are already familiar with this structured finance concept, this is a brief intro for non-finance folks.)
FiMarkets defines securitizations rather succinctly:
Securitization is a financial arrangement that consists of issuing securities that are backed by a pool of assets, in most cases debt. The underlying assets are “transformed” into securities, hence the expression “securitization.”
On one side of every securitization lie the assets, on the other side are the securities, the liabilities.
The assets are consumer debt — online personal loans, auto loans, mortgages.
When investors buy a part of a securitization they are essentially laying claim to some of money that debtors are due to pay in principal and interest. These claims on the money to be repaid form the liabilities side of a securitization.
Assets ALWAYS support liabilities: this is the fundamental accounting equation that allows one to judge just how risky a securitization is.
Very simply:
If assets > liabilities = good.
If assets < liabilities = bad.
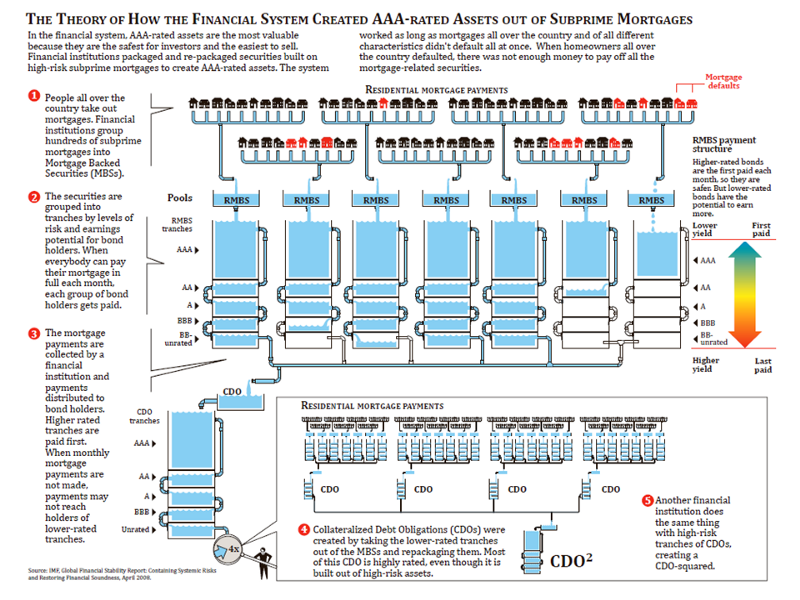
There are diagrams that explain the concept of a deal or securitization. Here’s one I like very much, from the IMF:
And then there are the diagrams of specific deals used by institutional investors and hedge funds. Here’s one that is specific to a securitization of Fannie Mae loans, that I pulled from a report from a big bank:
I suspect this diagram is reused for both Fannie Mae and Freddie Mac deals with just the tranche names switched out.
To get a sense of how a deal is structured and the risk associated with each tranche of a deal, traders have to use diagrams like this one in conjunction with unwieldy, multi-sheet excel docs.
Step 1: Visualizing the simplest of deal structures, a small Consumer Unsecured Deal
The consumer unsecured (CU) debt sector driven by P2P lenders only recently saw an uptick in activity in the secondary market. A lot of the debt in this space started to get securitized, and because the market was small, the deals were simple.
These were the first sort I learned about. On the “liabilities” end of things, early CU deals had 2–4 notes that were traded and unusually a fairly large residual.
Since the loans made were high-interest earning personal loads that held a lot of risk, investors who owned these loans that formed the collateral of these deals were able to package the traded notes as relatively low-risk, low return, while keeping the un-traded residual for themselves — very high risk, very high return.
My first design for a deal structure visualization was as simple as deals being described to me, a modified stacked bar chart with an annotation layer:
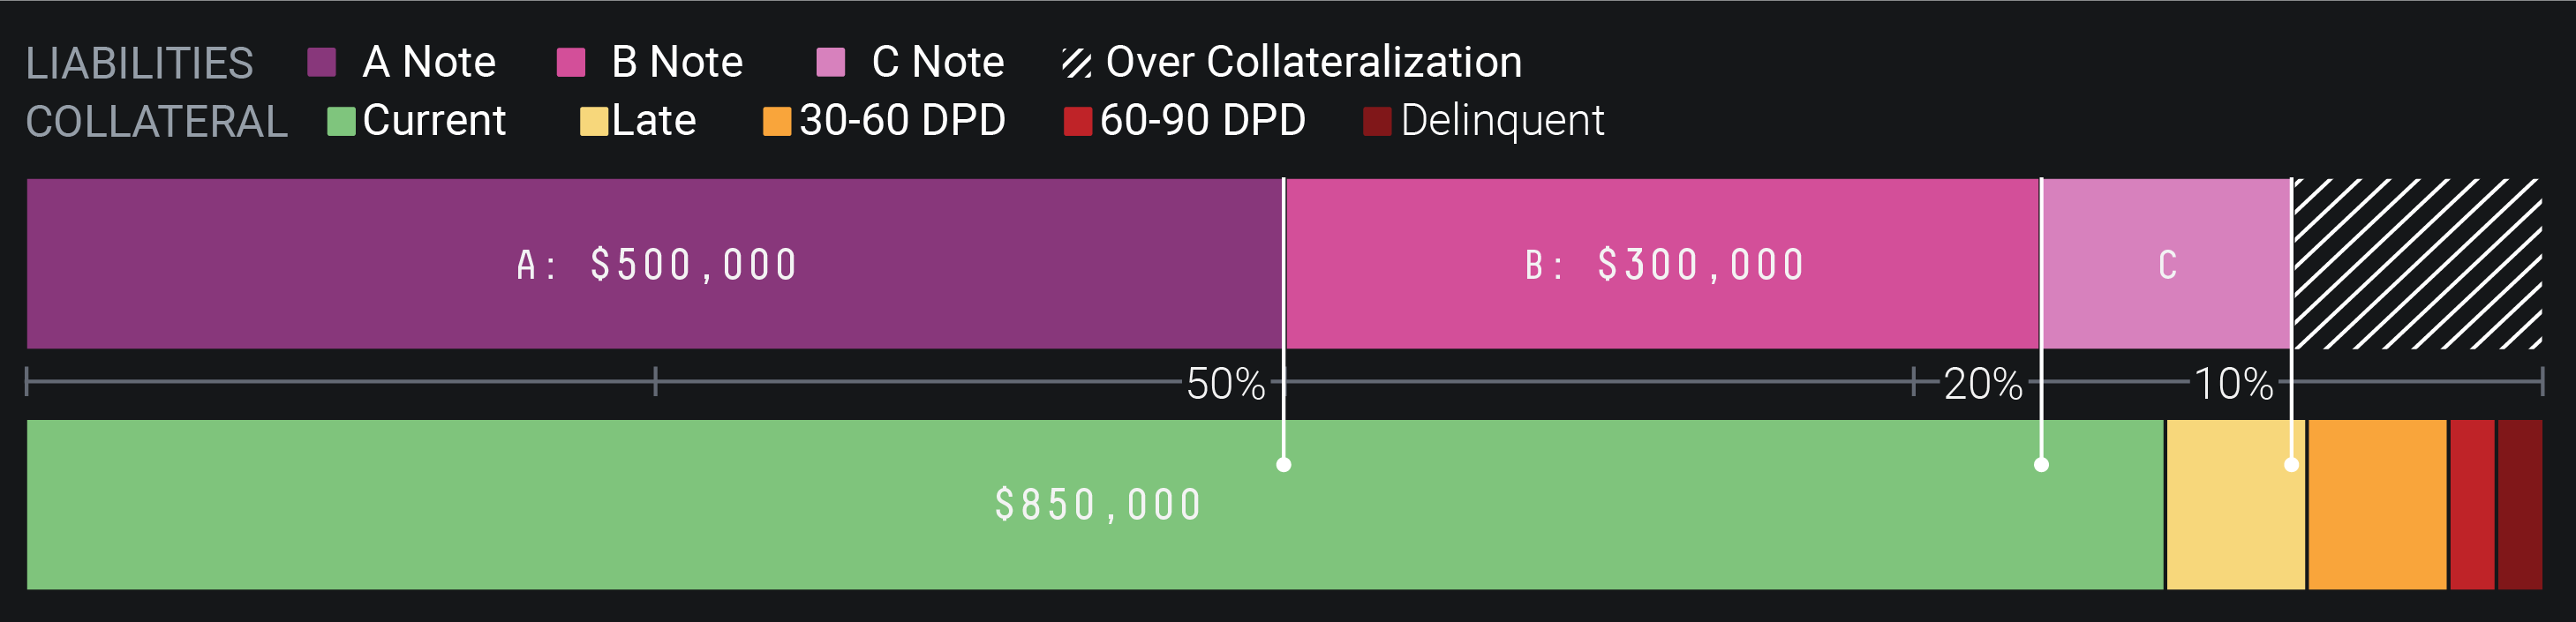
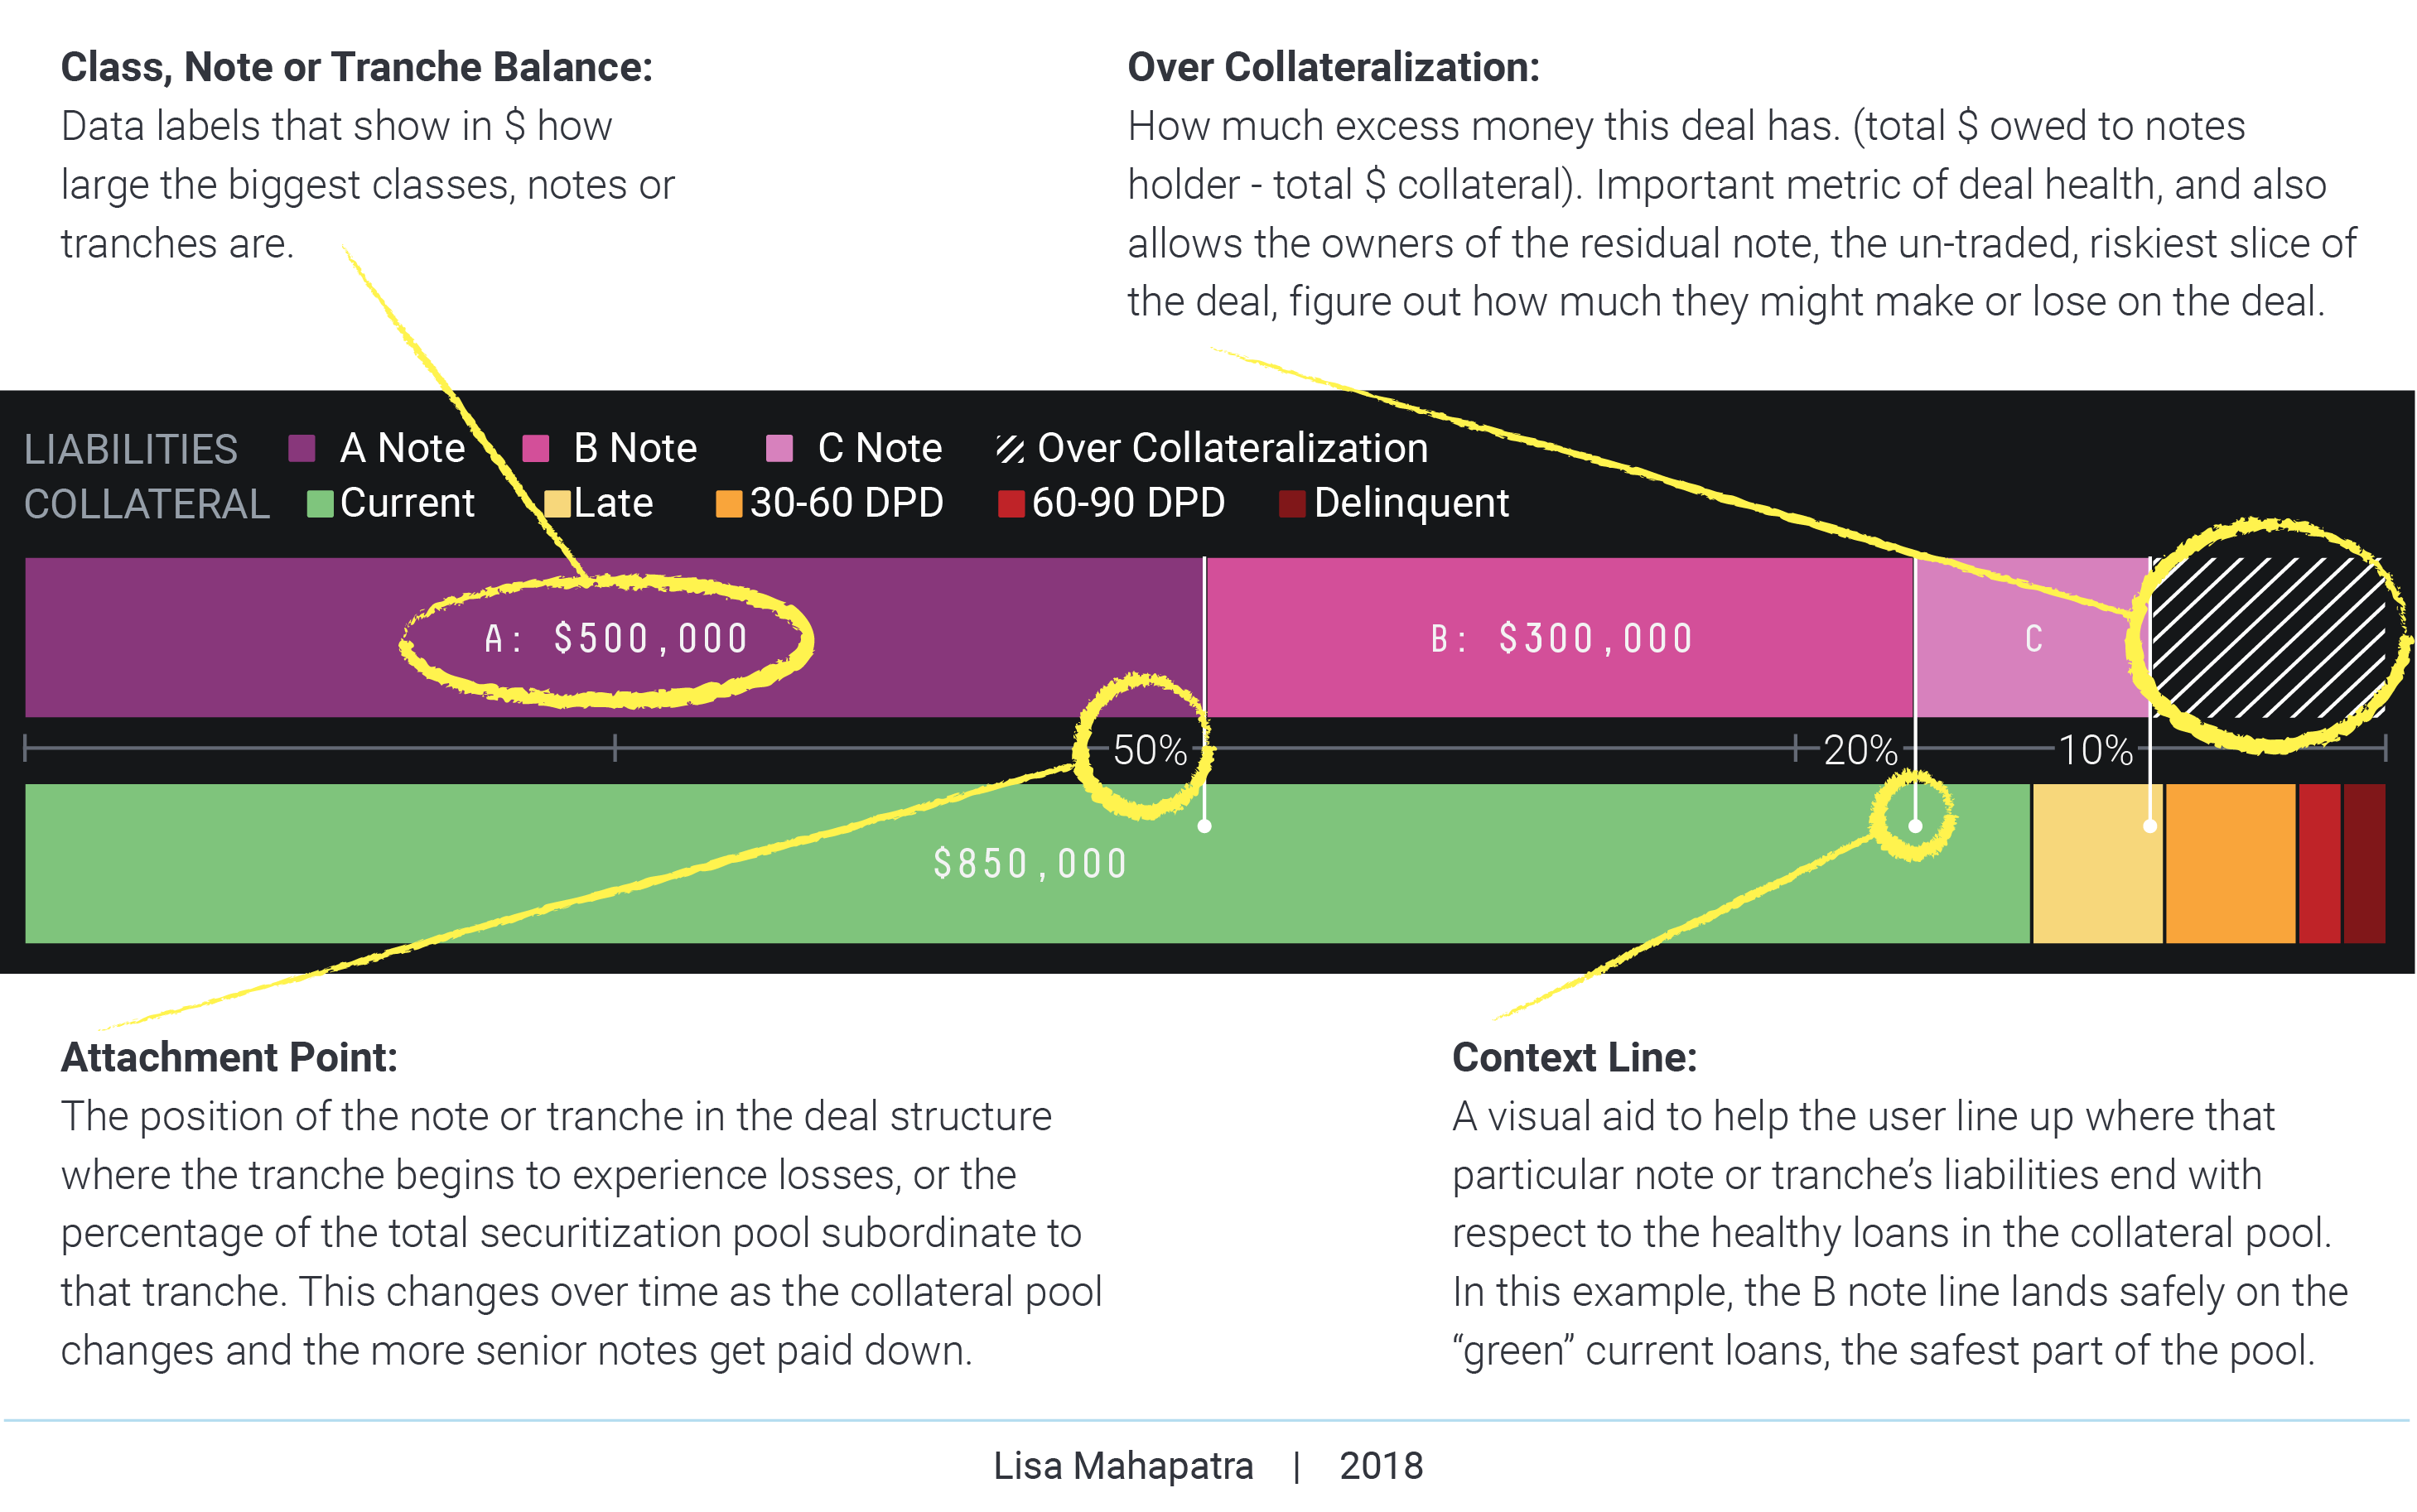
The bottom bar represents the collateral pool with loans categorized by repayment likelihood. The most likely to pay-in-full loans, or “current” loans are to the left, the loans that are most likely to default, more than 90 days-past-due are to the right.
It takes about 10 seconds to see that the A and B notes on the liabilities side of this deal (top bar) are well supported by the healthy loans in the collateral pool (bottom bar) but that the C note is not. It’s also easy to see that this deal has a healthy amount of OC (over collateralization) — the striped bit at the end of the top bar — which means the residual tranche, the un-rated, riskiest slice of the deal made up of whatever money is leftover after all the previous liabilities are paid off, stands to make a bunch of $$$ at the best of time, or next to nothing in case of too many defaults.
It’s a 100% stacked bar chart that lines up liabilities and assets in the order in which they are to be paid off. The top bar, in shades of pink, represent the liabilities. The first section on the left is the most senior note that still has payments remaining, and the last section to the right represents how much excess collateral supports the deal.
More context for those who aren’t so familiar with securitizations:
For more nuanced analysis, there’s no doubt that a trader would need to run some R-scripts or use an Excel macro on the raw data.
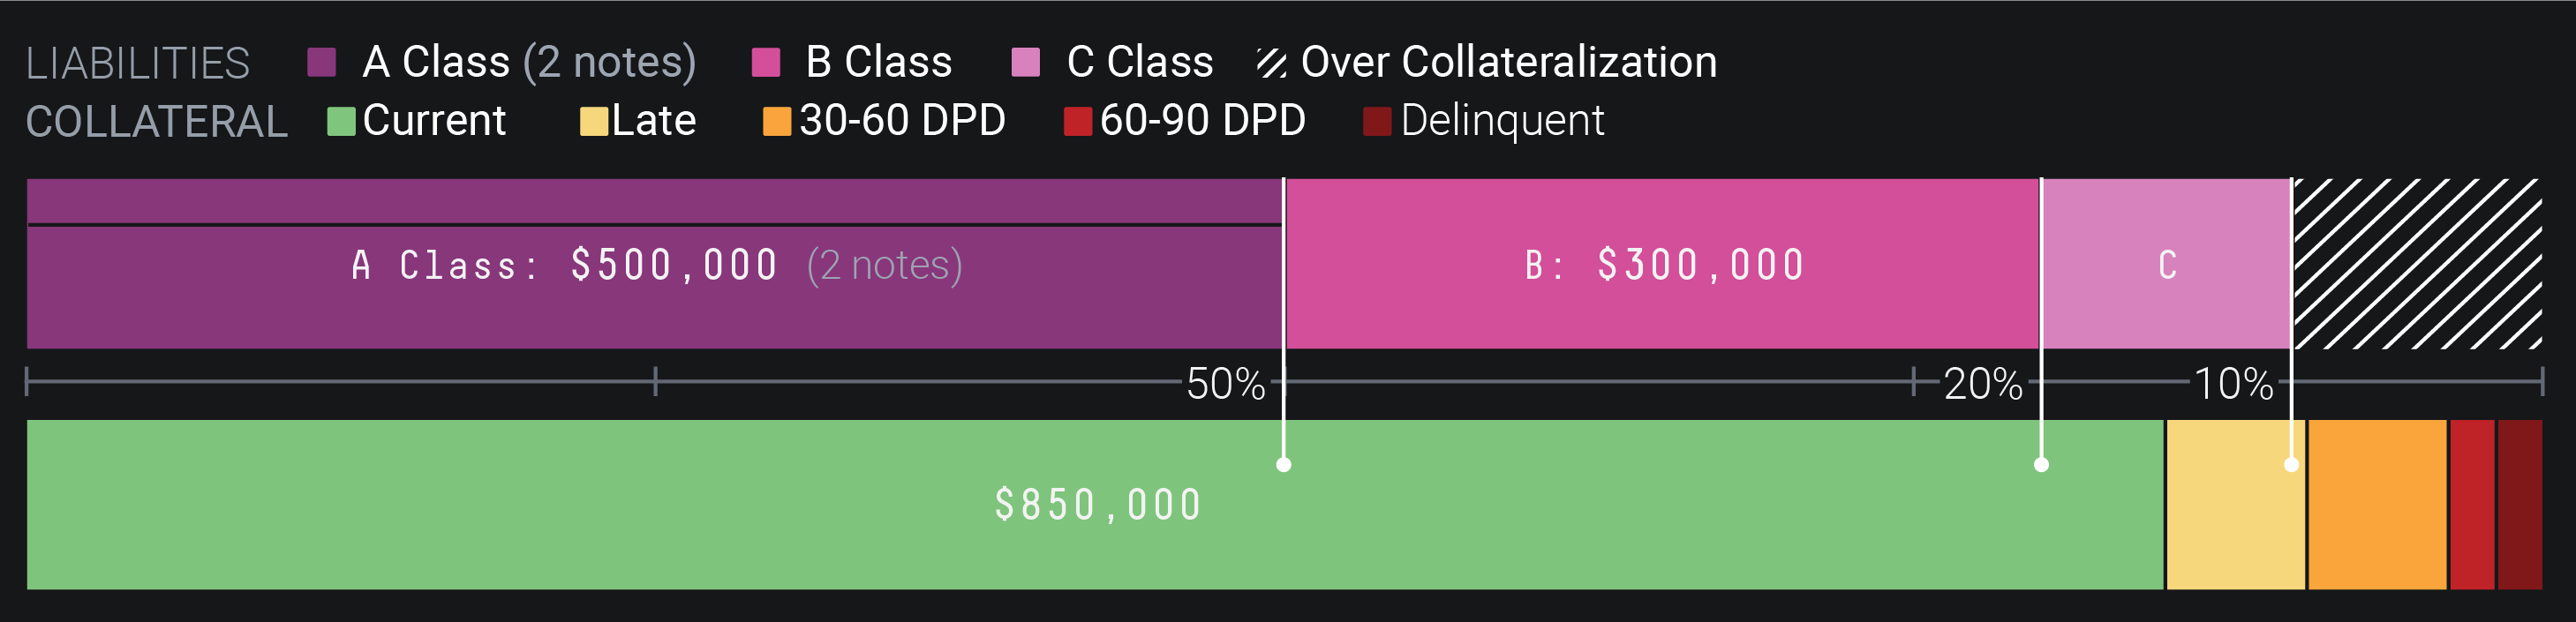
Step 2: A slightly more complex deal, now featuring classes and notes
Some deals divide up one section of the deal into smaller sections that hold the very similar amounts of risk, but have underlying contracts that are customized to their buyers requirements. Institutional investors often have very specific requirement for how contracts should be worded and they differ from investor to investor.
So now you have “classes” of notes. All of the notes in a single class usually carry the same amount of risk and are paid down simultaneously.
While previous designs depended mostly on the length of the bar, I now took advantage of the vertical space that they took to delineate notes within classes. Lining these notes up from left to right is misleading, it would imply that the one on the left carries less risk, which is not true.
Here’s an example of a deal where the A class has been split into 2 notes that each carry an equal amount of risk:
Step 3: The Y-structure deal
The older the asset class, the larger the market, the more complex the deals. The first Y-structure deal I came across was a student loan deal.
A Y-structure deal is one that combines two collateral pools. Usually, the most senior classes get paid only from one collateral pool each, while the rest of the more risky classes are paid from a combined pool of whatever is leftover.
Here’s an example of a Y-structure deal visulization that has two collateral pools, two senior classes that are the “top of the waterfall”, two junior classes and a small residual:
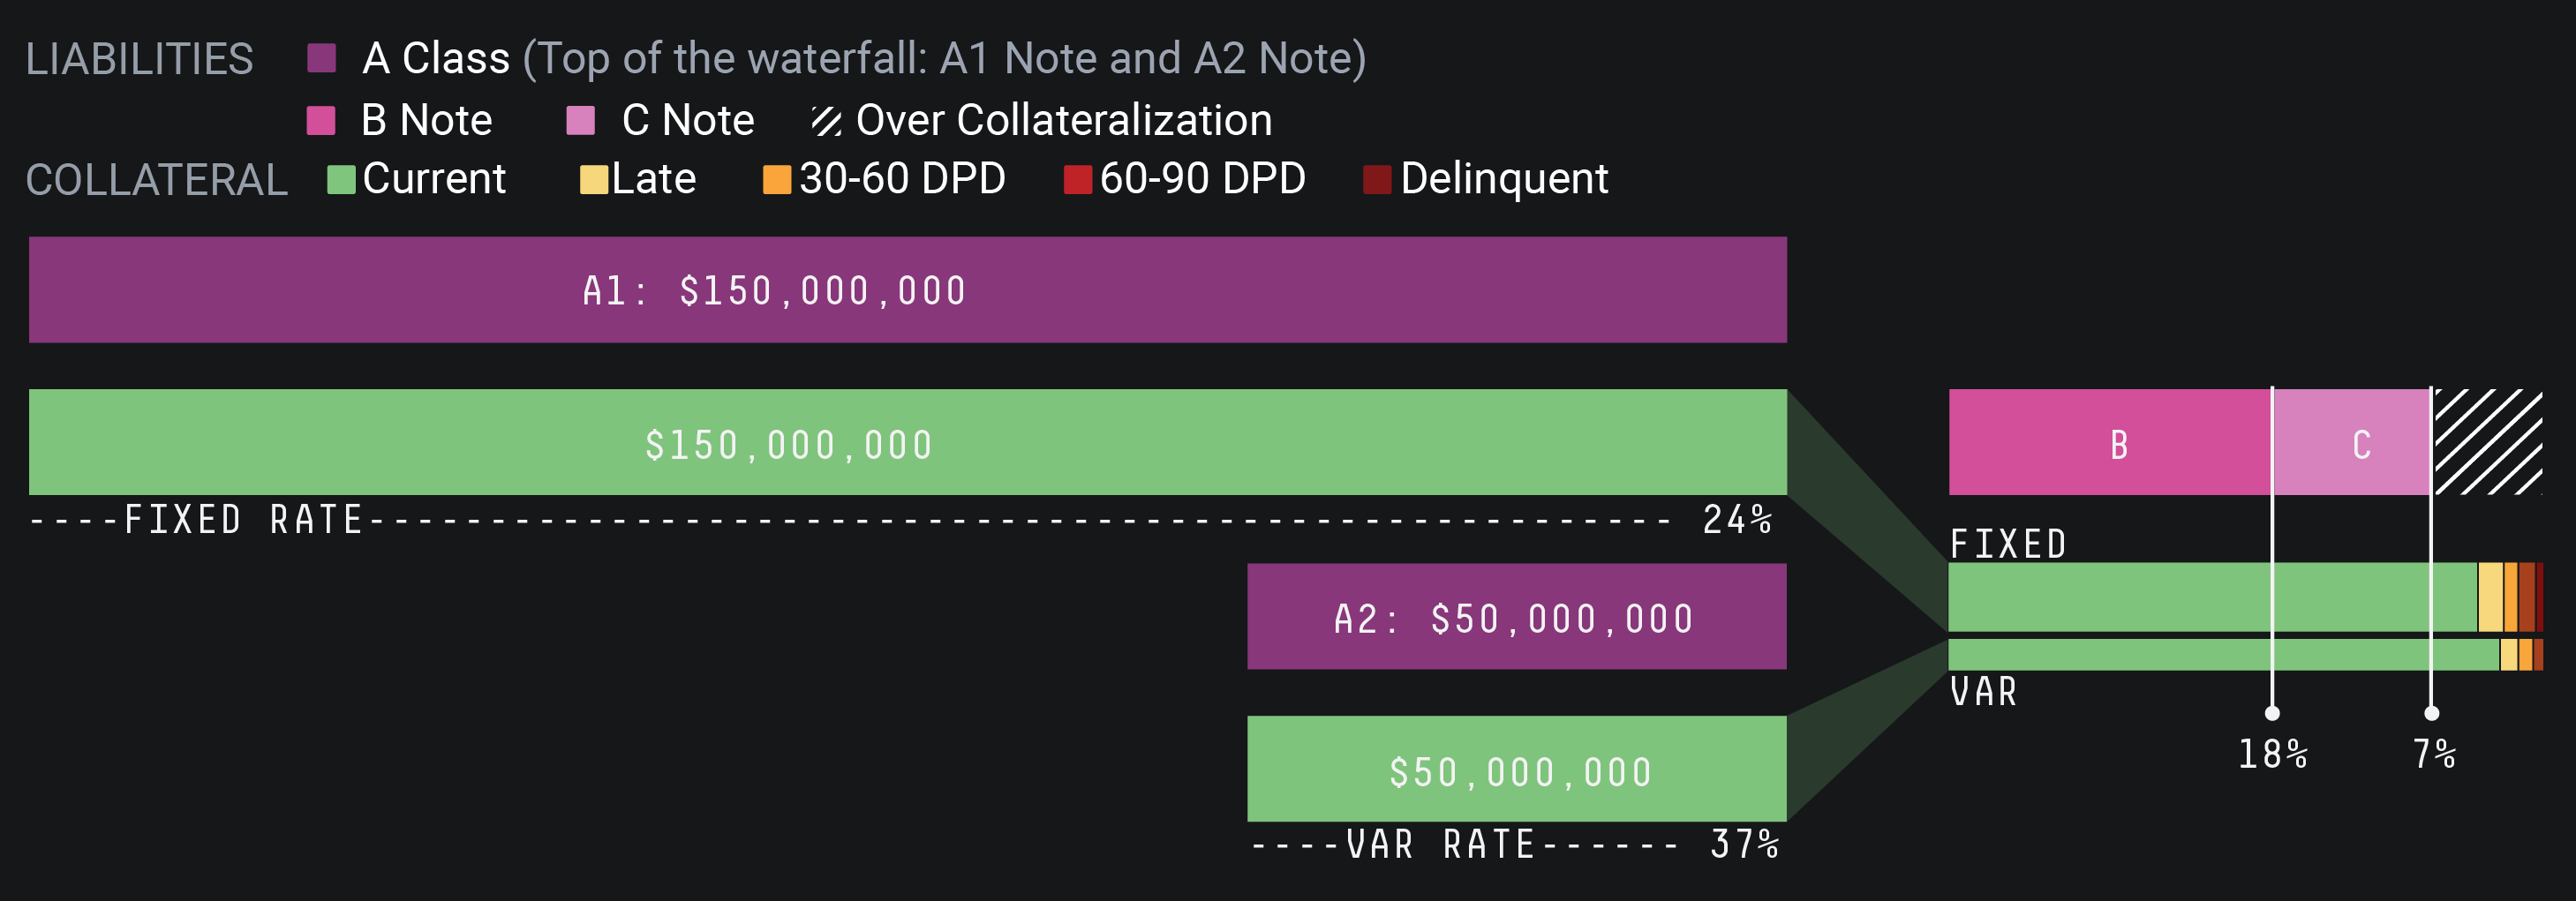
Since there are two collateral pools, they’re labeled: “Fixed Rate” and “Var Rate”. These are imaginary deals — in this scenario, one of the collateral pools consists only of fixed rate loans while the other consists of variable rate loans.
This visualization is functionally consistent with my first version of a deal structure visualization, which is pretty cool because when I first started designing deal structure visualizations I had no idea what a Y-structure deal was and how it worked.
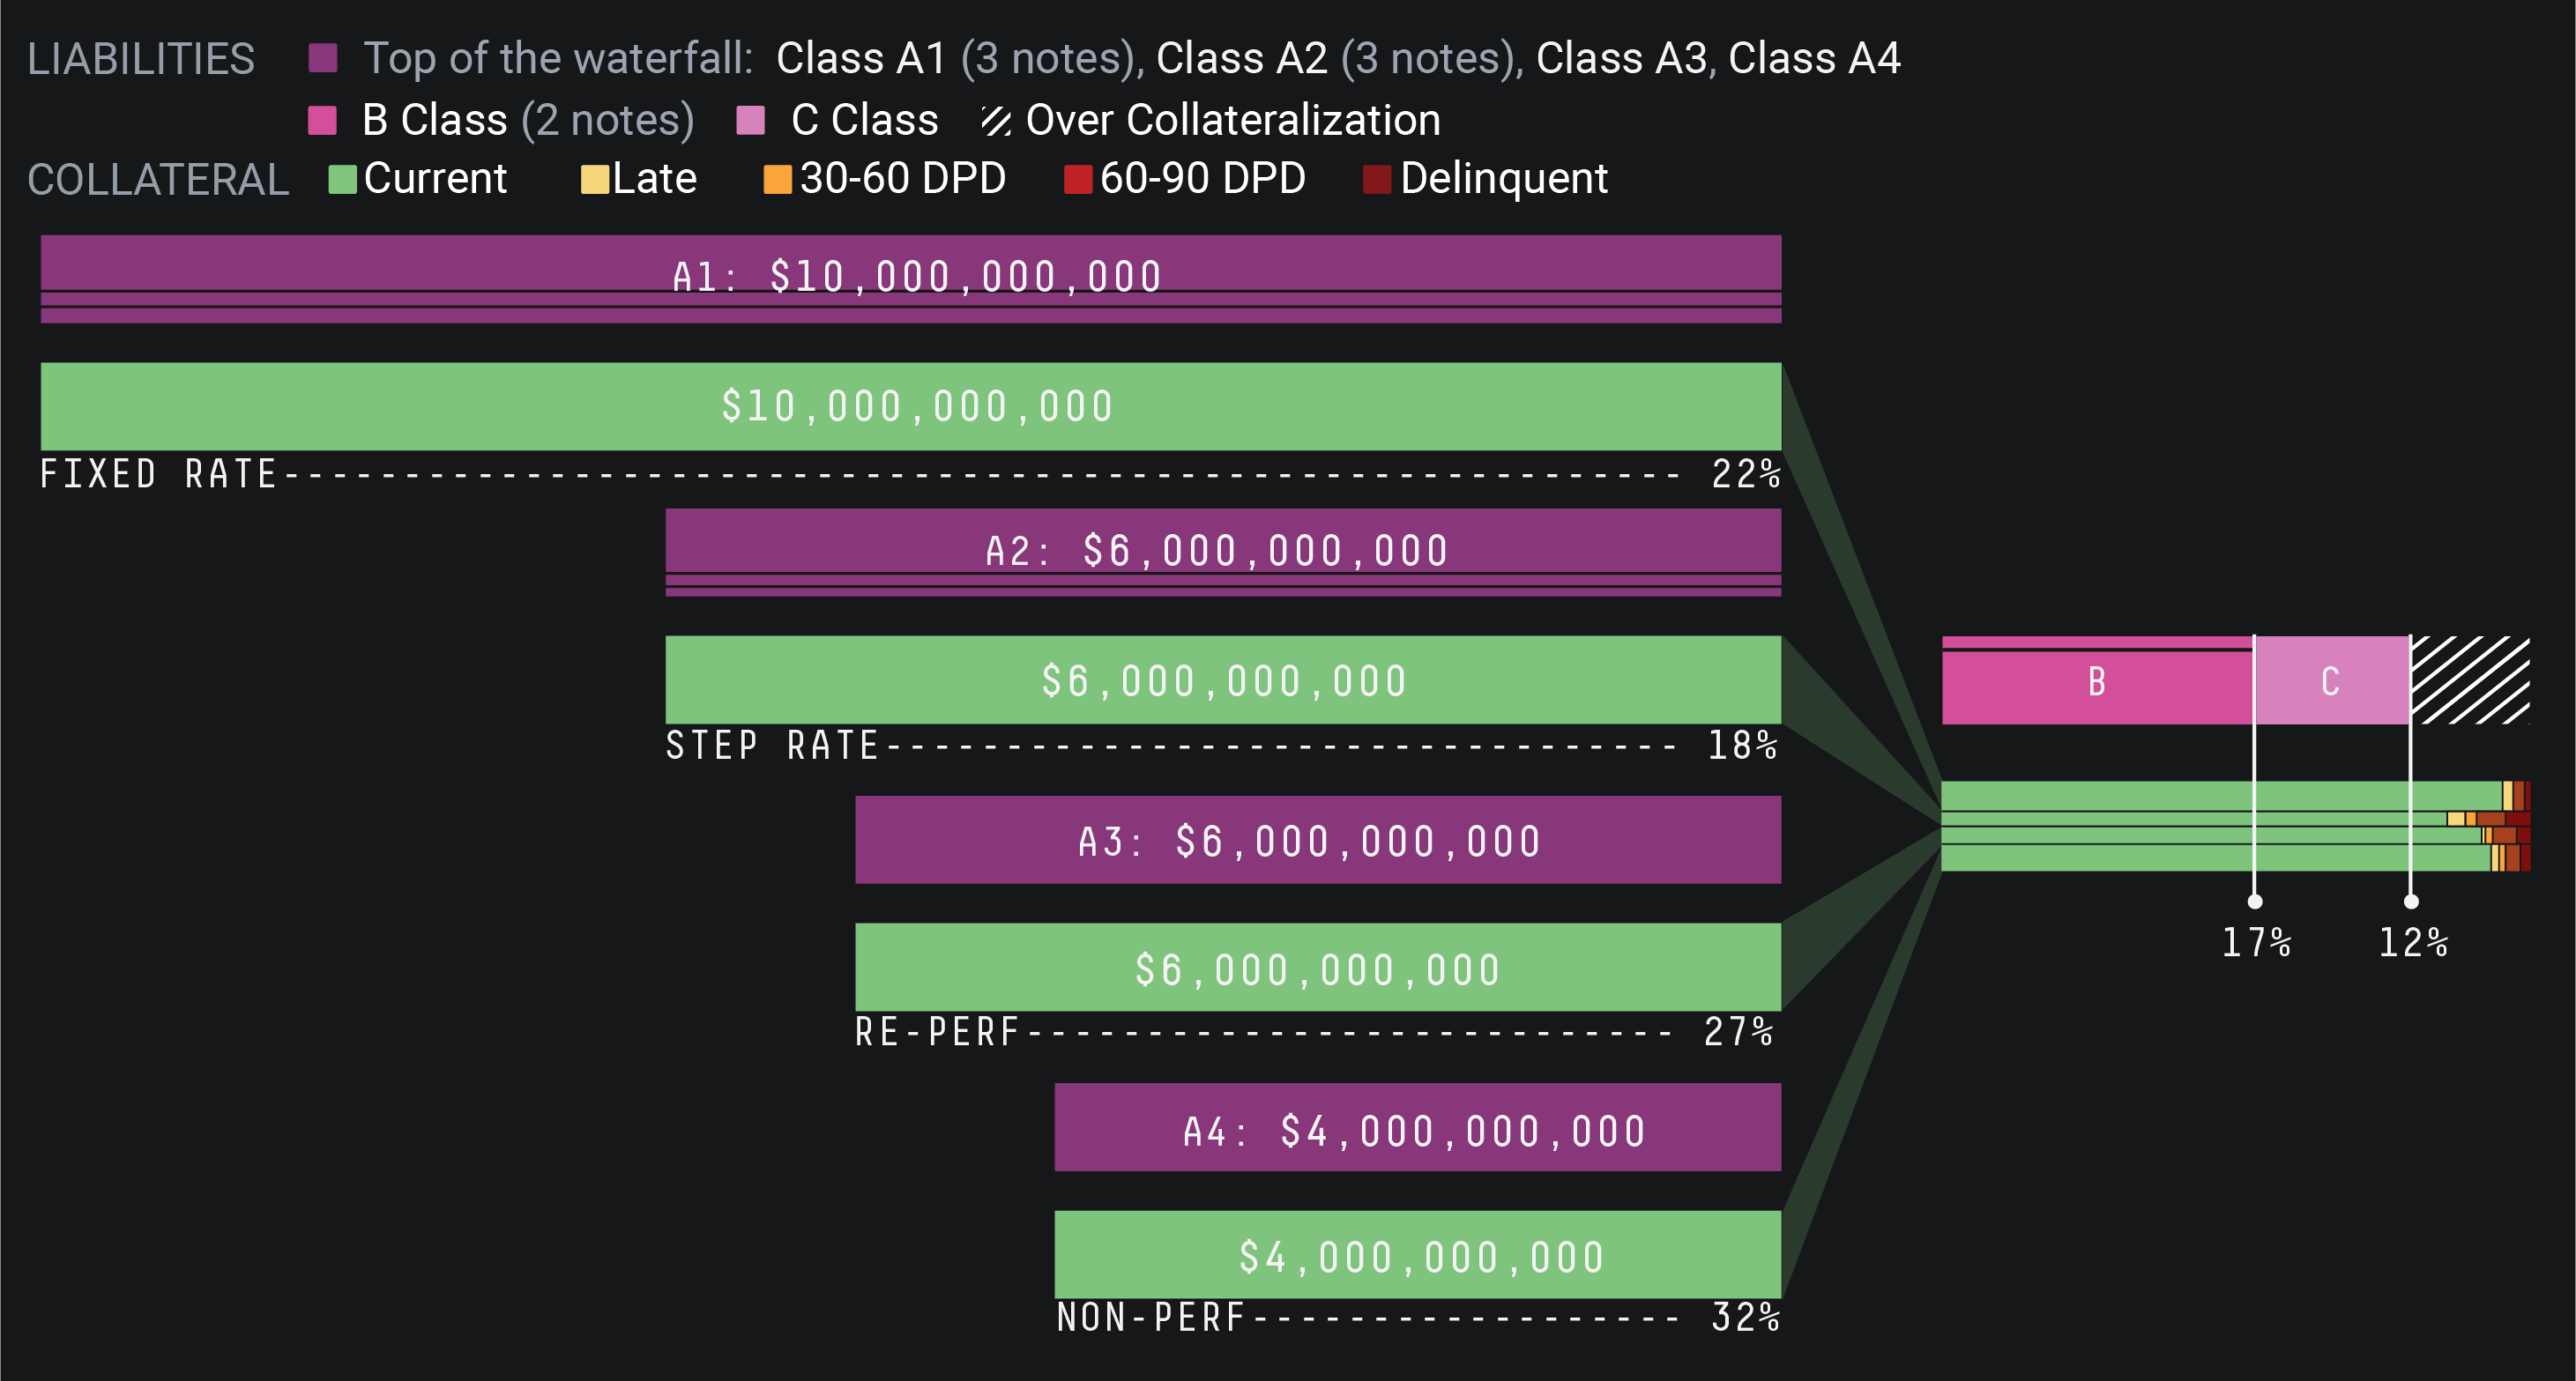
This visualizations works with far more complex deals. I tried it out with a deal that had four collateral pools and while it needs to be a bit larger to be fully legible, it works:
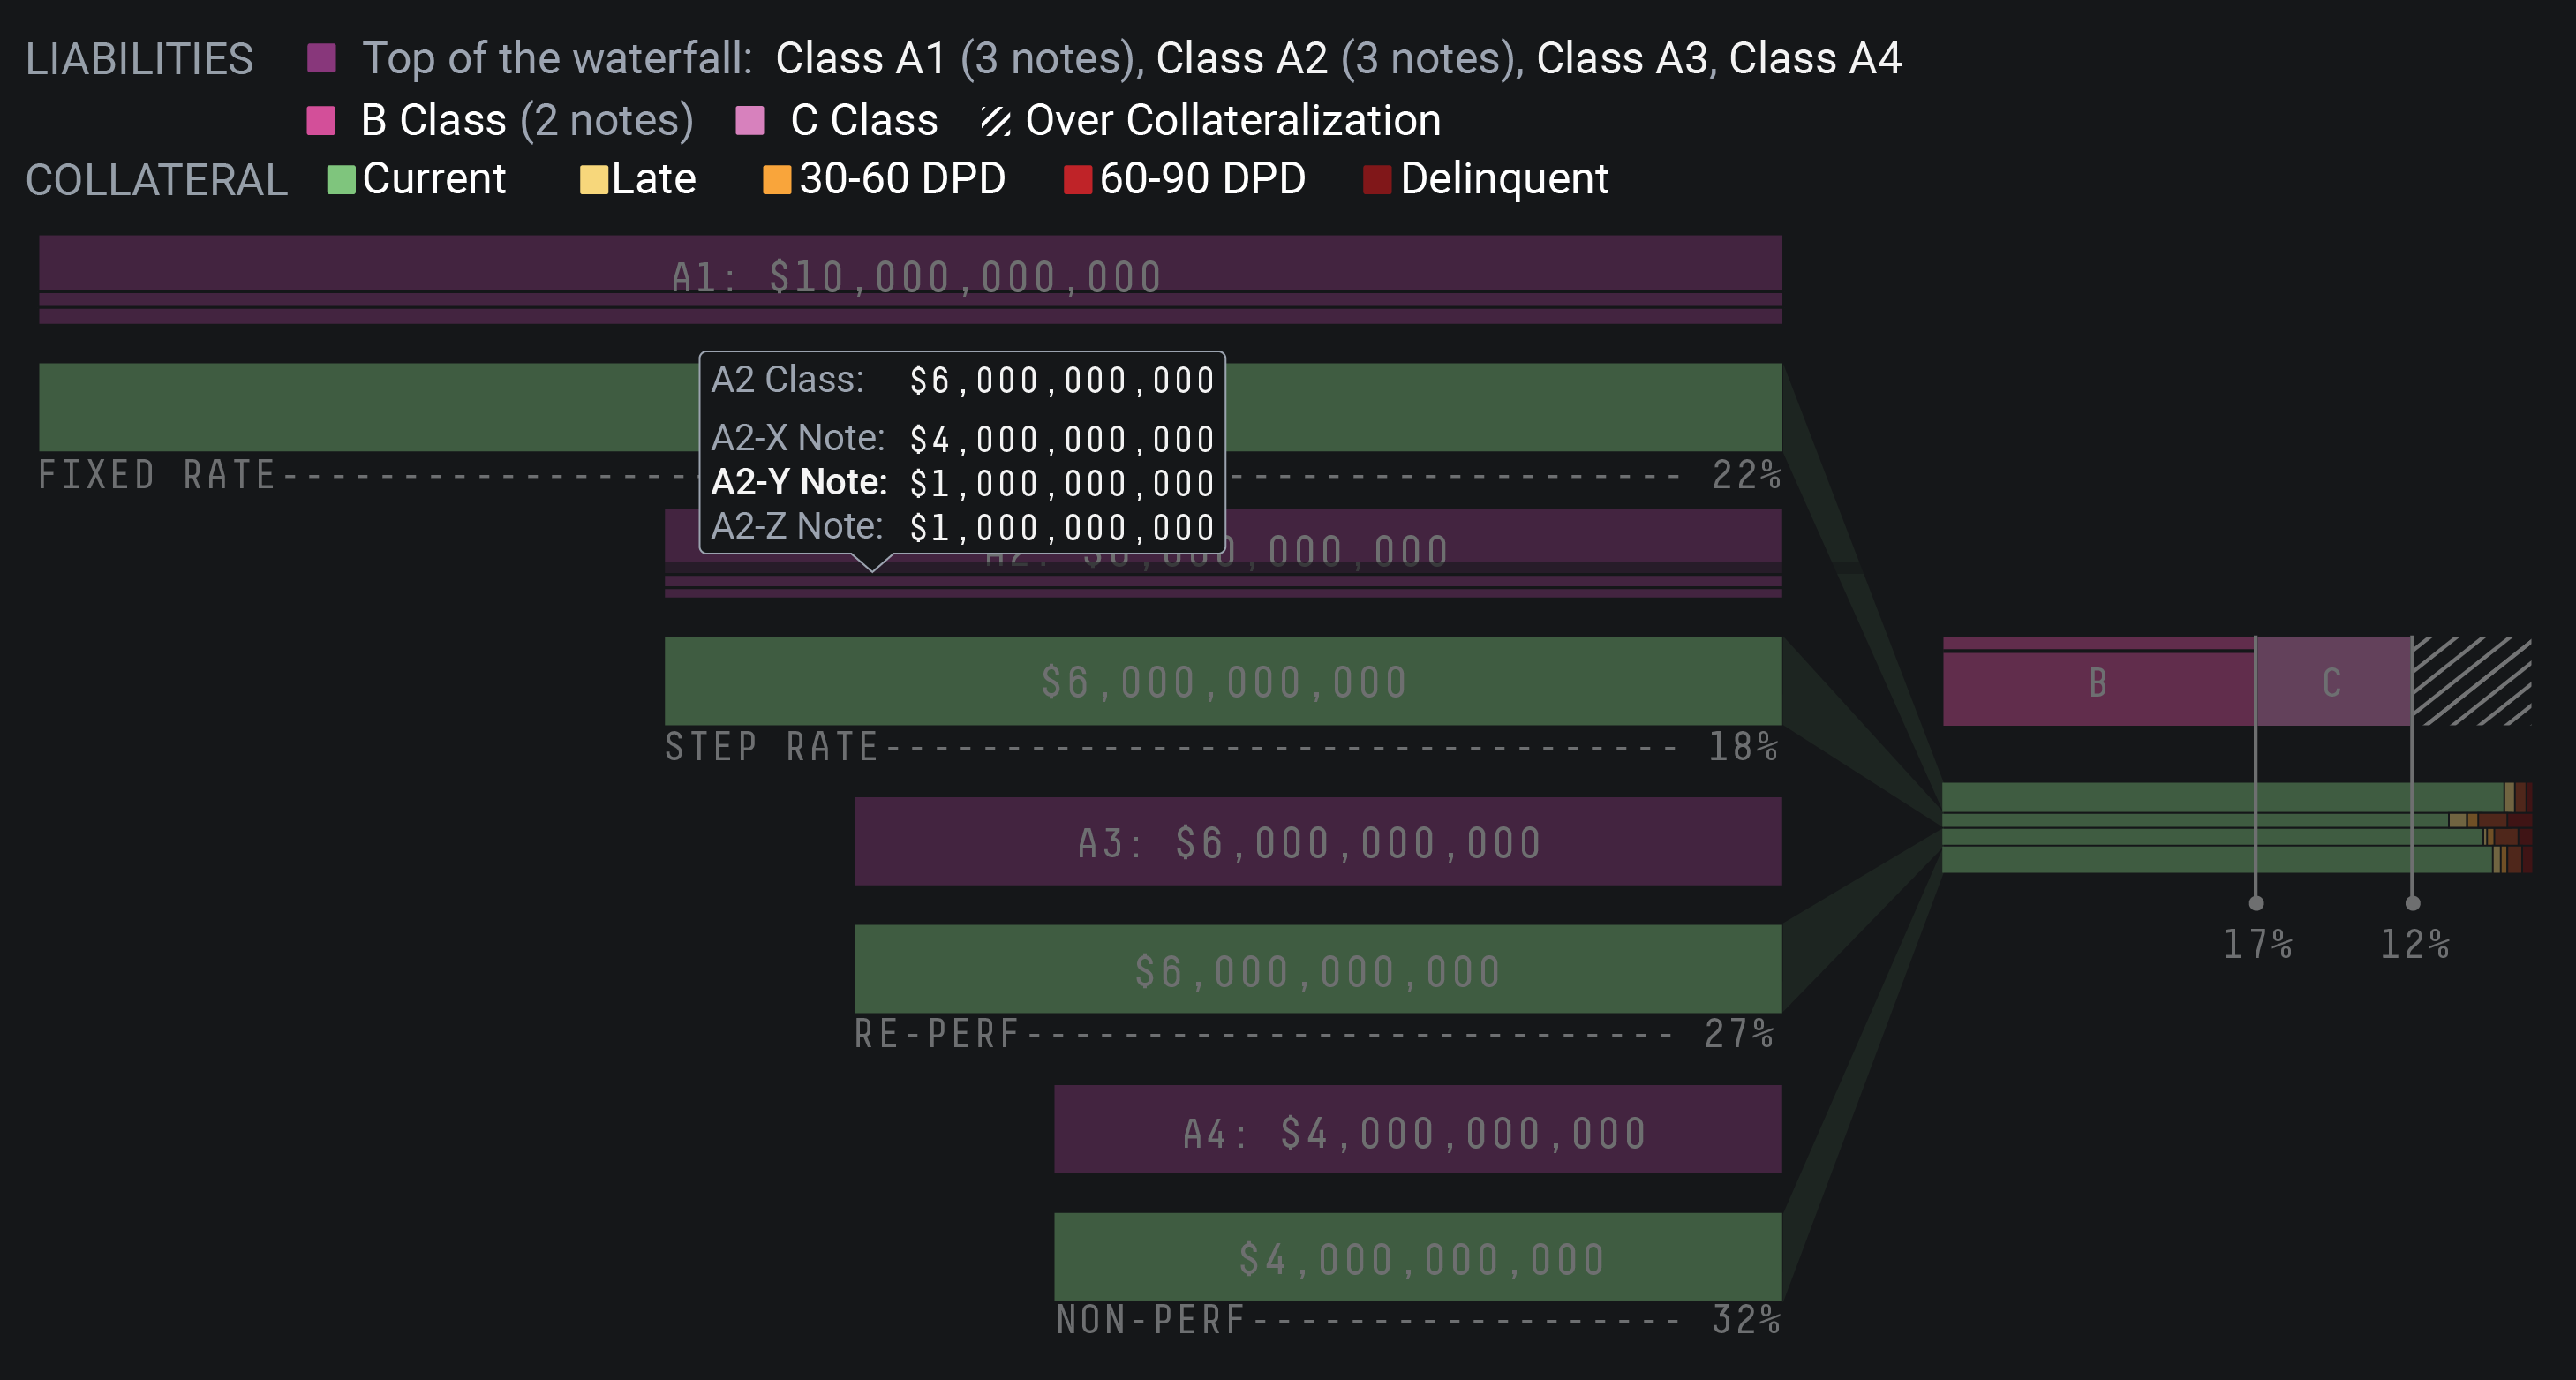
Good thing all of these charts were designed with handy tooltips that pop up when you hover over any tranche.
There’s a lot more nuance to securitizations. Each asset class has it own quirks. For example, in mortgage securitizations you see a larger variety of loan statuses like “forbearance” and “deferred”. Some securitizations contain notes that are retained by the investor creating the deal and never get traded on the open market.
This deal structure visualization has mostly been able to take on whatever wonky securitization scenario the deals that have been thrown at me so far.
There’s one thing I know I haven’t designed for yet —the first is an H-structure deal. H-structure deals were very popular prior to the financial crisis, but there aren’t a lot of new deals that use the H-structure anymore, so I haven’t needed to tackle that design problem just yet.
Note: All of the deals visualized here are completely made up and do not represent any real securitizations.
